Scraping NOAA tide prediction data for the 'Frisco Bay
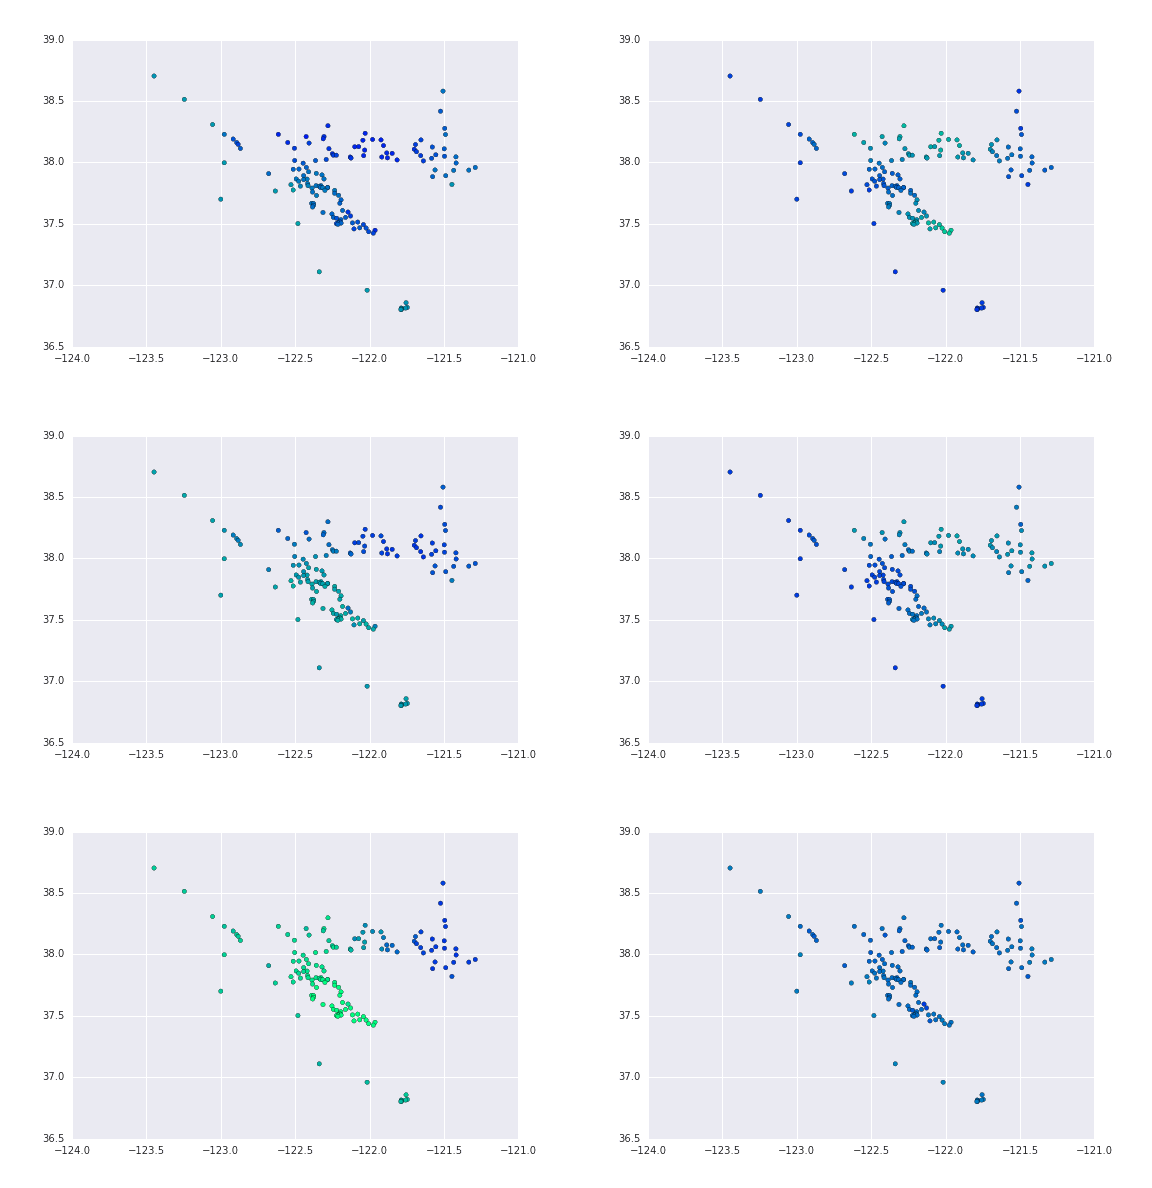
Wrote a little Python (too) late last night to scrape and munge some tide station data from NOAA:
This file contains hidden or bidirectional Unicode text that may be interpreted or compiled differently than what appears below. To review, open the file in an editor that reveals hidden Unicode characters.
Learn more about bidirectional Unicode characters
import urllib2 | |
import numpy as np | |
import matplotlib.pyplot as plt | |
import pandas as pd | |
%matplotlib inline | |
import seaborn | |
# return numerical angle from the degrees/minutes format NOAA publishes | |
def parse_angle(a): | |
w = float(a.split('° ')[0]) | |
f = float(a.split('° ')[1].split("'")[0]) | |
s = a.split("' ")[1] | |
v = w + f/60. | |
if (s == 'W') or (s == 'S'): | |
v *= -1 | |
return v | |
# download station info page and return location | |
def get_station_location(station_number): | |
response = urllib2.urlopen('https://tidesandcurrents.noaa.gov/stationhome.html?id=' + str(station_number)) | |
html = response.read() | |
post_latitude = html.split('<td>Latitude</td><td>')[1] | |
latitude = post_latitude.split('</td>')[0] | |
longitude = post_latitude.split('<td>Longitude</td><td>')[1].split('</td>')[0] | |
return (parse_angle(latitude), parse_angle(longitude)) | |
# start with a list of stations near the Bay Area | |
stations = ["9416409", "9416174", "9416024", "9415846", "9415625", "9415623", "9415565", "9415498", "9415469", "9415584", "9415478", "9415446", "9415447", "9415415", "9415396", "9415402", "9415414", "9414811", "9415379", "9415344", "9415339", "9415338", "9415320", "9415316", "9415307", "9415265", "9415266", "9415287", "9415252", "9415228", "9415165", "9415257", "9415236", "9415227", "9415193", "9415205", "9415176", "9415218", "9415149", "9415142", "9415143", "9415144", "9415145", "9415105", "9415117", "9415112", "9415111", "9415096", "9415102", "9415095", "9415074", "9415064", "9415052", "9415056", "9415053", "9415020", "9415021", "9415009", "9414883", "9414881", "9414873", "9414874", "9414868", "9414367", "9414866", "9414863", "9414849", "9414958", "9414843", "9414837", "9414835", "9414836", "9414819", "9414816", "9414818", "9414817", "9414806", "9414792", "9414785", "9414906", "9414305", "9414782", "9414779", "9414290", "9414777", "9414764", "9414765", "9414763", "9414767", "9414317", "9414275", "9414750", "9414746", "TWC0509", "9414334", "9414724", "9414711", "9414358", "9414262", "9414688", "9414391", "TWC0547", "9414392", "9414402", "9414413", "9414637", "9414632", "9414449", "9414458", "9414621", "9414609", "9414483", "9414486", "9414501", "TWC0573", "9414506", "9414505", "9414523", "9414509", "9414507", "9414131", "9414511", "9414513", "9414519", "9414539", "9414575", "9414525", "9414561", "9414549", "9414551", "9413878", "9413745", "9413663", "9413651", "9413631", "9413626", "9413624", "9413623", "9413617", "9413616"] | |
locations = [get_station_location(s) for s in stations] | |
locations = np.array([[v[0], v[1]] for v in locations]) | |
def get_station_log(station_number): | |
url = "https://tidesandcurrents.noaa.gov/noaatidepredictions/NOAATidesFacade.jsp?datatype=Annual+TXT&Stationid=" + str(station_number) + "&text=datafiles%252F9414305%252F17122016%252F924%252F&imagename=images%2F9414305%2F17122016%2F924%2F9414305_2016-12-18.gif&bdate=20161217&timelength=daily&timeZone=2&dataUnits=1&interval=&edate=20161218&StationName=San+Francisco%2C+North+Point%2C+Pier+41&Stationid_=9414305&state=CA&primary=Subordinate&datum=MLLW&timeUnits=2&ReferenceStationName=San+Francisco&ReferenceStation=9414290&HeightOffsetLow=%2B0.00&HeightOffsetHigh=%2B0.20&TimeOffsetLow=11&TimeOffsetHigh=13&pageview=dayly&print_download=true&Threshold=&thresholdvalue=" | |
request = urllib2.urlopen(url) | |
txt = request.read().split('\n') | |
def linear_search(txt): | |
for i in range(len(txt)): | |
if txt[i][:4] == 'Date': | |
return i | |
skip = linear_search(txt) | |
log = pd.read_table(url, skiprows=skip, parse_dates=[['Date ', 'Day']]) | |
log = log.rename(columns={'Time': 'Height', 'Date _Day': 'Date'}).set_index('Date') | |
log = log.drop('Unnamed: 1', 1).drop('Unnamed: 4', 1).drop('Pred(Ft)', 1).drop('Pred(cm)', 1) | |
return log | |
def interpolate_height(log, date): | |
before = log[log.index <= date] | |
if len(before) == 0: | |
return None | |
before = before.iloc[-1] | |
after = log[log.index > date] | |
if len(after) == 0: | |
return None | |
after = after.iloc[0] | |
height = (before['Height'] - after['Height']) / 2 | |
x = np.pi * (date.value - before.name.value) / (after.name.value - before.name.value) | |
offset = (after['Height'] + before['Height']) / 2 | |
value = height * np.cos(x) + offset | |
return value | |
def get_interpolated_times(): | |
ds = [] | |
d = pd.Timestamp('2016-01-01 00:00:00') | |
while (d.value < pd.Timestamp('2017-01-01 00:00:00').value): | |
ds.append(d) | |
d += pd.Timedelta('30 minutes') | |
return ds | |
def get_interpolated_heights(log): | |
heights = [] | |
d = pd.Timestamp('2016-01-01 00:00:00') | |
while (d.value < pd.Timestamp('2017-01-01 00:00:00').value): | |
heights.append(interpolate_height(log, d)) | |
d += pd.Timedelta('30 minutes') | |
return heights | |
tide_data = pd.DataFrame(get_interpolated_times()).rename(columns={0: 'Date'}).set_index('Date') | |
for station in stations: | |
if station not in tide_data.keys(): | |
print(station) | |
try: | |
log = get_station_log(station) | |
heights = get_interpolated_heights(log) | |
tide_data[station] = heights | |
except: | |
print(" ERROR") | |
stations = tide_data.keys() | |
# map tide height to a color | |
def map_values(v): | |
v = 255 * (v + 1) / 8 | |
return plt.get_cmap('winter')(int(v)) | |
for i in range(2000, 2200): | |
plt.figure() | |
plt.scatter(locations[:,1], locations[:,0], c = [map_values(v) for v in tide_data.iloc[i]]) | |
plt.savefig(str(i)+".png") | |
plt.close() |
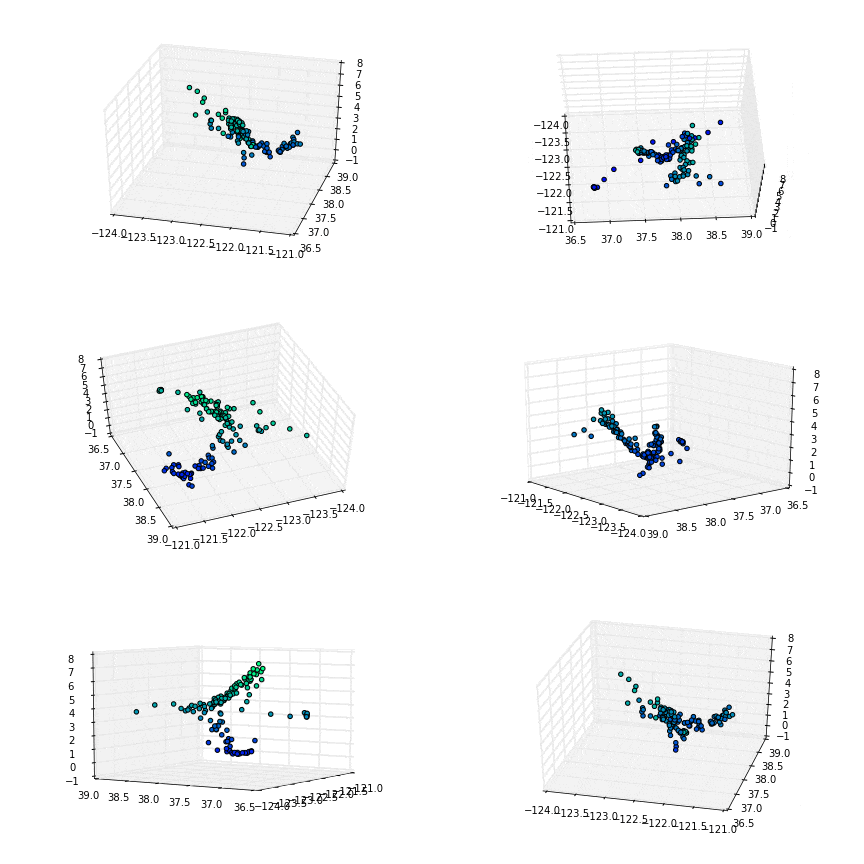
The result: