Observable Notebooks (RC Week 11 Day 5)
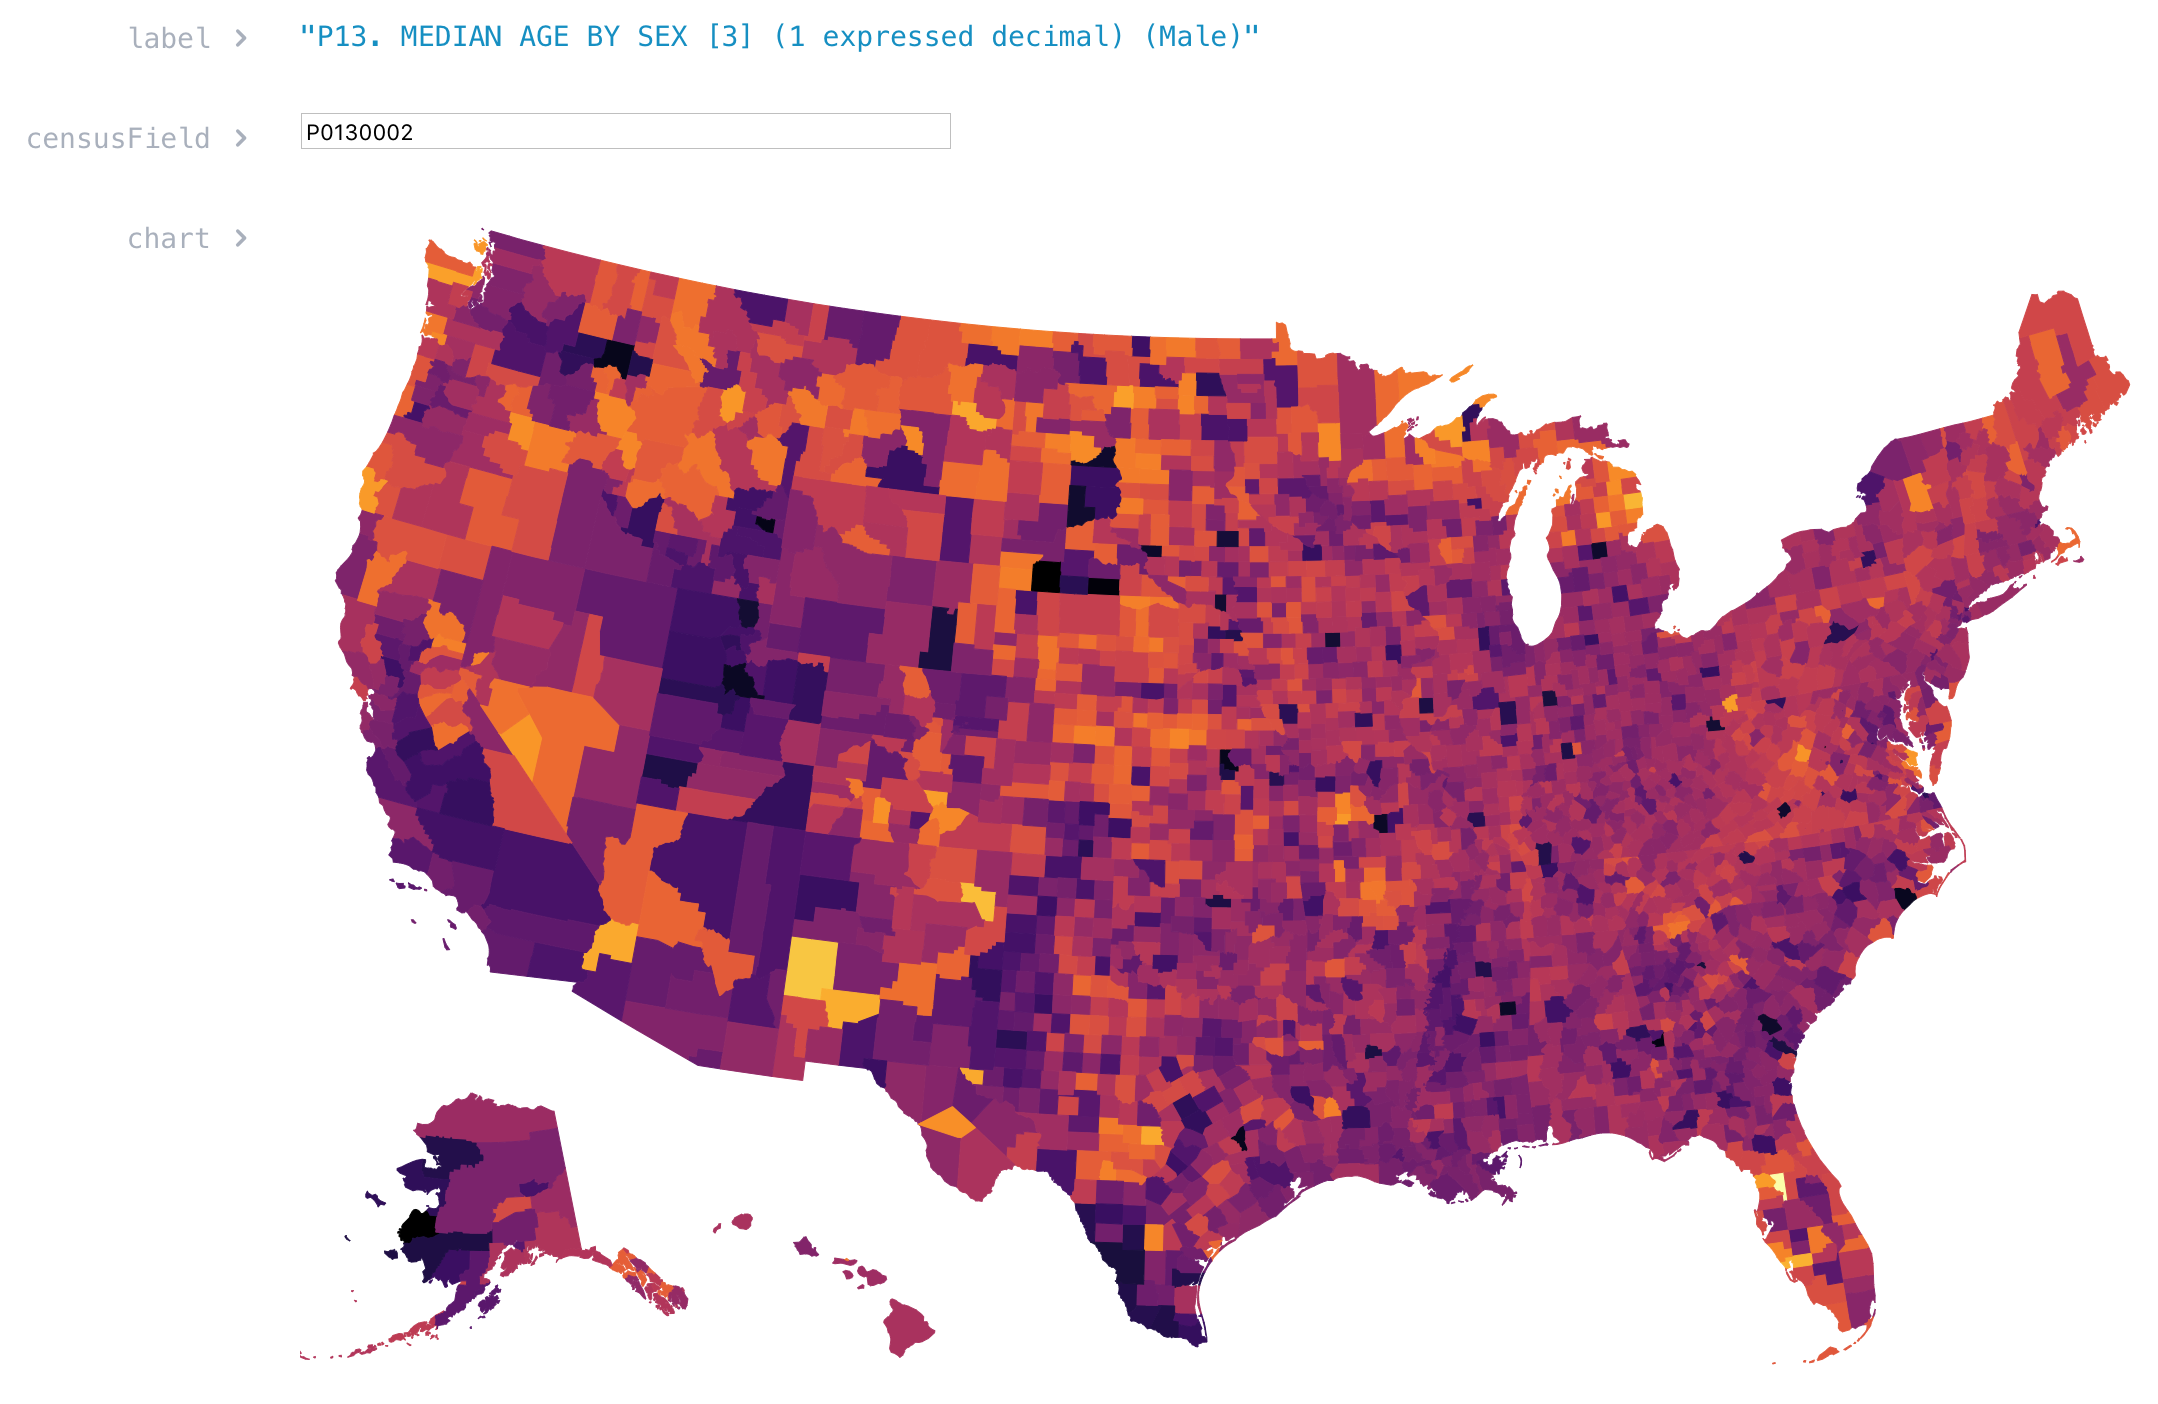
James and I paired on creating something with Mike Bostock’s Observable Notebooks. We made a notebook that uses D3.js and some convenient TopoJSON repositories to automatically download and map Census data variables.

Some work needs to be done:
- Better UI for selecting variables
- Title and legend on the map
- Multivariate comparisons
- Check box for normalizing by population
But we got it working! Two major revelations about Observable Notebooks:
- They are not Jupyter notebooks. They are not stateful and the order of the cells does not matter.
- Everything is just web development. If you want a range slider, just add a
<input type="range">to the cell.