iNaturalist observations: "locals" and "tourists"
In 2010, cartographer Erica Fischer made some simple and spectacular maps of images added to Flickr. She classified photos as either from “locals” or “tourists”, based on how far their profile location was from the photo’s geotag. These maps revealed fascinating psychogeographic patterns of urban exploration and photographic worthiness.
Last summer, Dario Taraborelli suggested extending this to iNaturalist observations.
Remember the classic "Locals & Tourists" dataviz project by @enf? Has anyone tried applying the same method (<30 days posting photos from a given location: you're a "tourist"; >=30 days: you're "local") to @Team_eBird / @inaturalist data to measure local community participation? pic.twitter.com/1QdSZKB2RH
— Dario Taraborelli (@ReaderMeter) June 12, 2022
It’s taken a while, but here it is:
⛶ View in a new tab
Observations and thoughts
San Francisco
It’s nice to look at places that you know well to get bearings for how the map represents data. Here’s San Francisco and Marin:
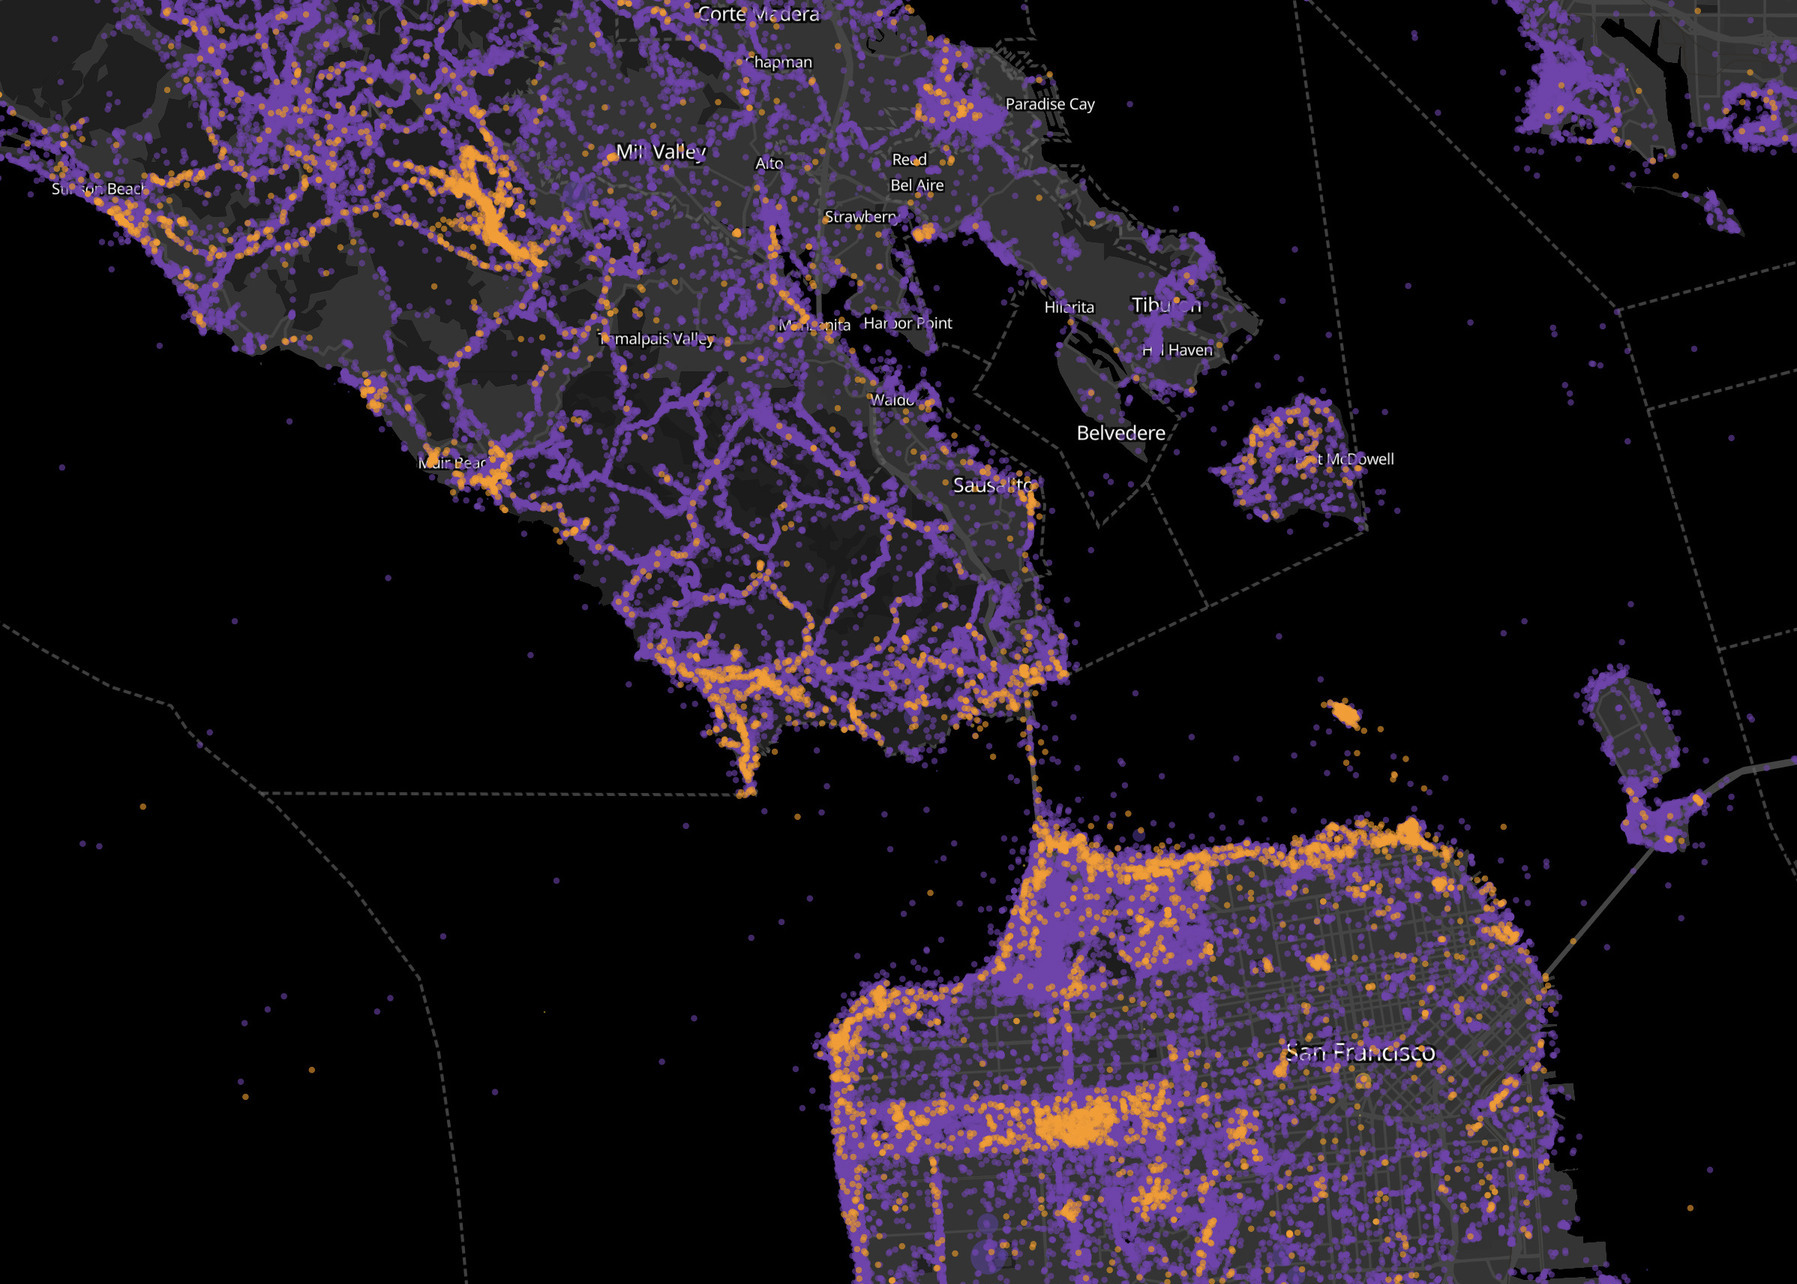
Expectedly, we see that the Embarcadero and Fisherman’s Wharf are bright orange, indicating many observations from “tourists”. Muir Woods also stands out as a visitor hotspot, and in contrast the surrounding trails around Mt. Tamalpais contain primarily local observations.
Where are people finding access to nature within urban centers? Clearly in San Francisco, the Embarcadero (and Alcatraz) are places where visitors notice and interact with urban wildlife. What are these locations in your city? Are there opportunities to enhance the natural aspects of these destinations, or to make urban ecosystems more legible to visitors?
How it works
Each dot on the map is an observation on iNaturalist (or, if you are zoomed out, a cluster of observations.) If a user has more than 3 months of observation history in the local area (difference between the earliest and latest observation), that point is tagged as “local”. Otherwise, it is tagged as “tourist”. Users with very little observation history are rendered in gray, since it is not possible to tell.
Of course, this methodology has some substantial limitations. The “tourist” and “local” labels are not really accurate, just memorable monikers for the two groups (and an allusion to Erica Fischer’s earlier maps, mentioned above.) Notably, it is not possible to know if a user is really local to an area or has just visited it multiple times, as on an annual holiday. Similarly, a user’s observations might be classified as “tourist” in their hometown if they have only used iNaturalist previously while traveling.
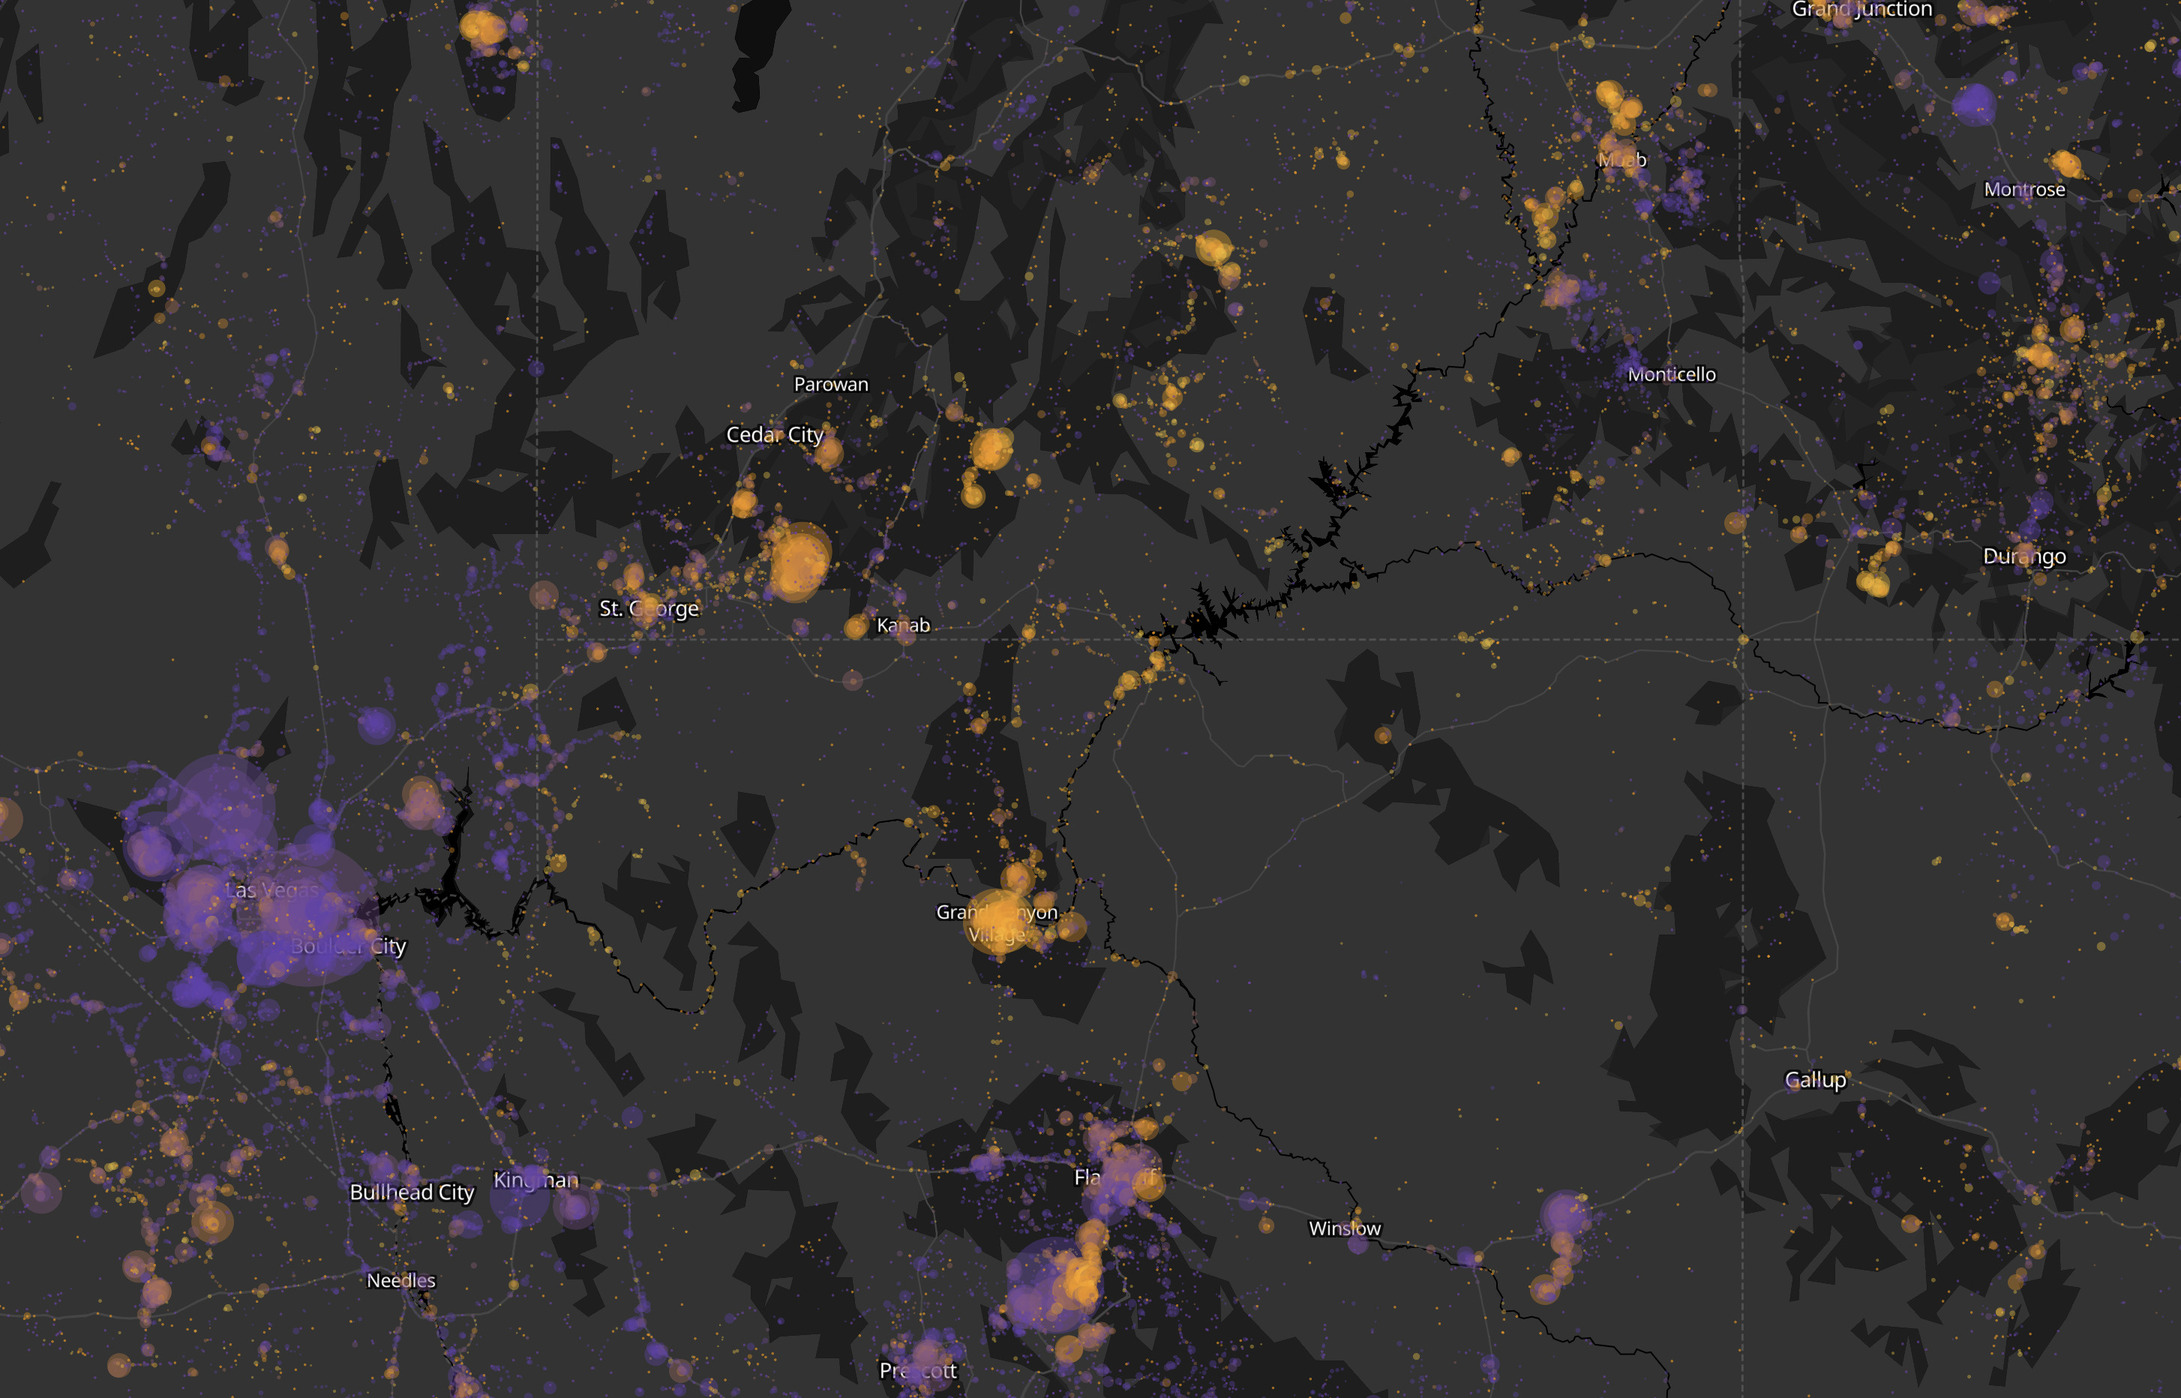
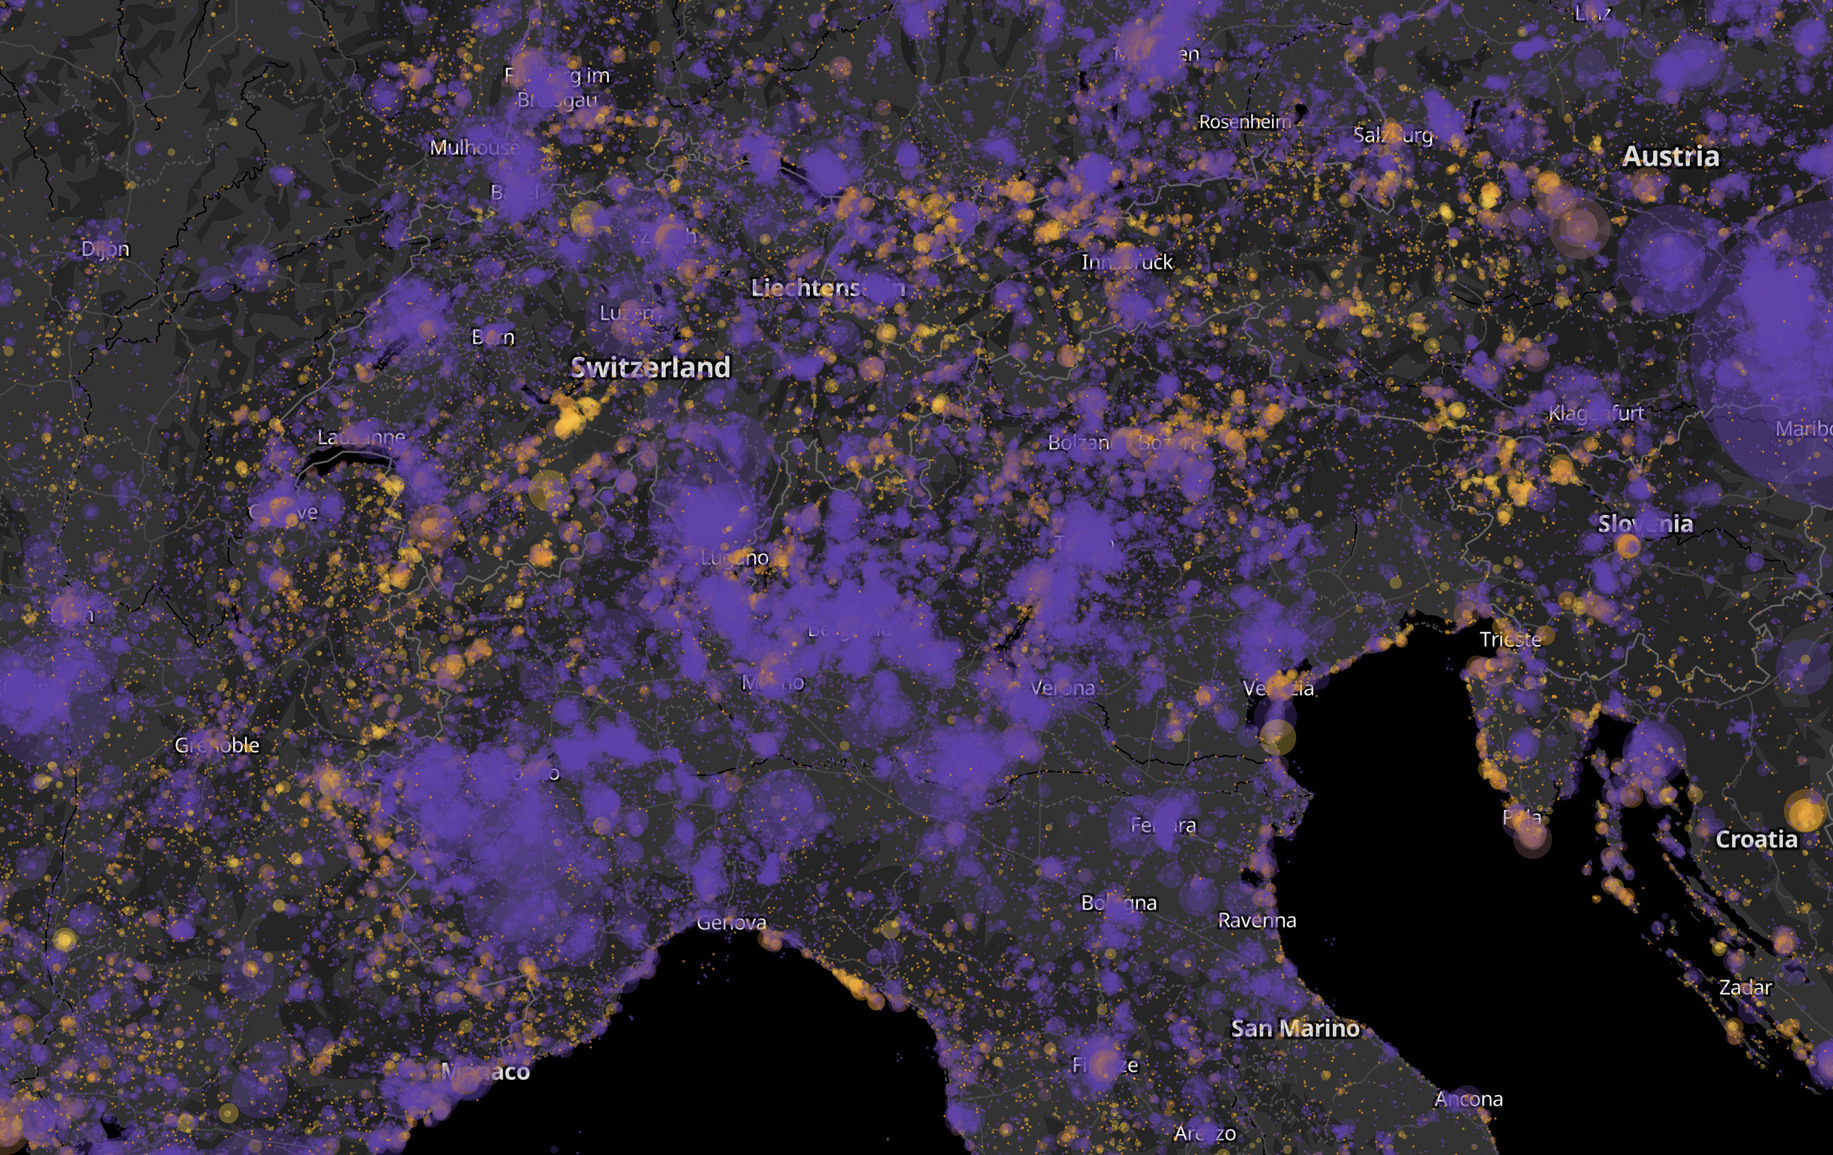
Holiday destinations
Still, there are compelling patterns. Low population density areas that are popular vacation destinations, like the American Southwest and the Alps, clearly have more “tourist” observations.
Central America
Another geographic region that stands out globally is Central America, especially Costa Rica. The majority of iNaturalist observations in Costa Rica are by users that do not have extensive history in the region.
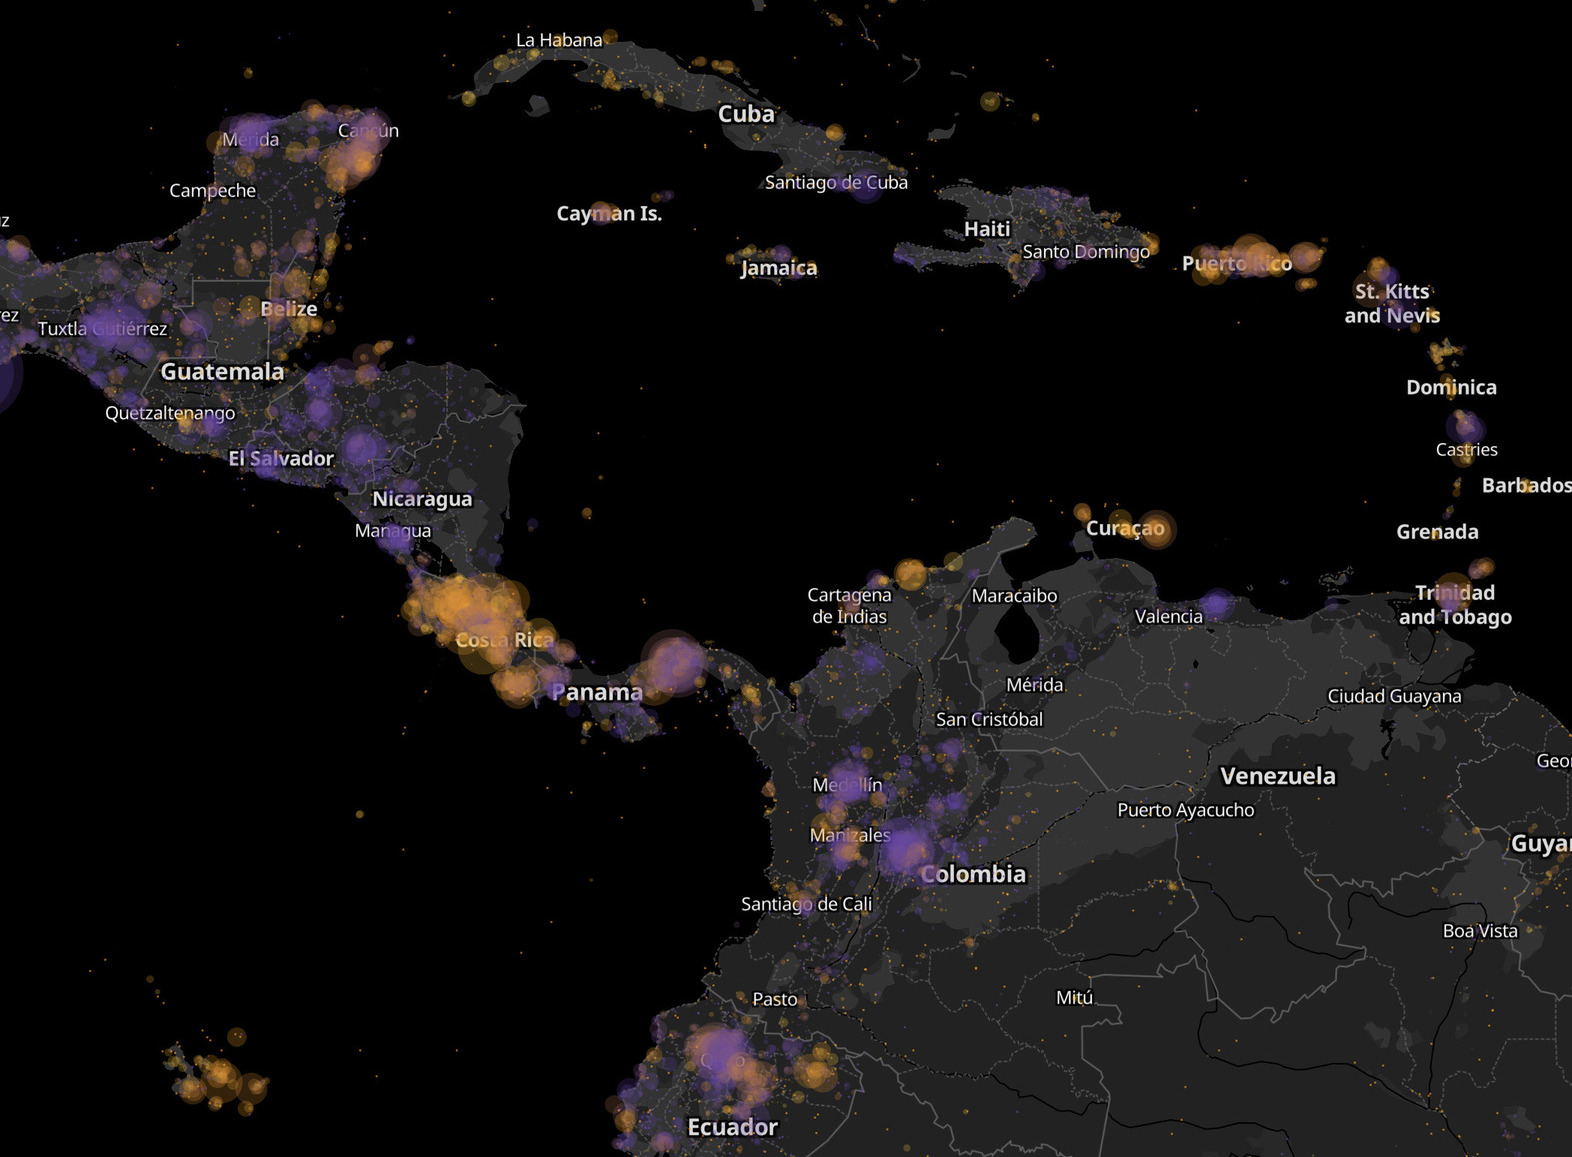
This is unsurprising given Costa Rica’s popularity for tourism and iNaturalist’s userbase, which still tilts towards the Global North.
This could indicate that despite the large number of observations in the region, the local iNaturalist community has room to grow, reach more local residents, and become more robust.
Technical details
I downloaded iNaturalist observations in bulk from GBIF, which means that this only includes “research-grade” observations. The data is from November 2022, but I am working on updating it with a more recent extract. Update: As of March 23rd, the data is current to mid-March.
I initially tried to calculate the number of observations by the same user within a radius of each of their observations. However, even with a Postgres/PostGIS query that seemed to be taking advantage of every indexing opportunity it had, this would take months.
SELECT * FROM observations
CROSS JOIN LATERAL (
    SELECT COUNT(*) AS n, MIN("eventDate") AS first, MAX("eventDate") AS last
    FROM observations o
    WHERE o."inaturalistLogin" = observations."inaturalistLogin"
    AND ST_DWithin(o.geom_merc, observations.geom_merc, 25000)
) near
LEFT JOIN posts_by_user
ON posts_by_user.username = observations."inaturalistLogin"
Though CROSS JOIN LATERAL was pretty cool, I needed a different approach and used H3 tiles at size 3. I was a little worried that this would result in some visible boundary effects, but it seems to be a good approximation.
It took some work with tippecanoe in order to tile the data in a way that looked nice at low zooms. Clustering points worked well once I tuned the parameters.
To serve the data for webmaps, Brandon Liu’s PMTiles. It’s really amazing work, and HTTP Range Requests are magical. Mapbox would have charged me somewhere between $120 and $3750 per month for tileset hosting, but instead, I have put a single file in an S3 bucket and PMTiles requests what it needs.
