Analyzing bus stop spacing with GTFS data
Early morning on the B48, my mind turns, as so oft it does, to thoughts of the Brooklyn Bus Network Redesign. Alas, the dream remains distant, and here in 2025 the bus still makes a scheduled stop on almost every 270 ft block.
The bus lurches forward just as the light ahead turns red. New York City must have some of the closest bus stop spacing in the world. Could GTFS transit data prove this?
Okay, well probably not, since public GTFS data doesn’t exist everywhere and it’s an approximation of how transit works in practice. But some fundamental patterns are clear!
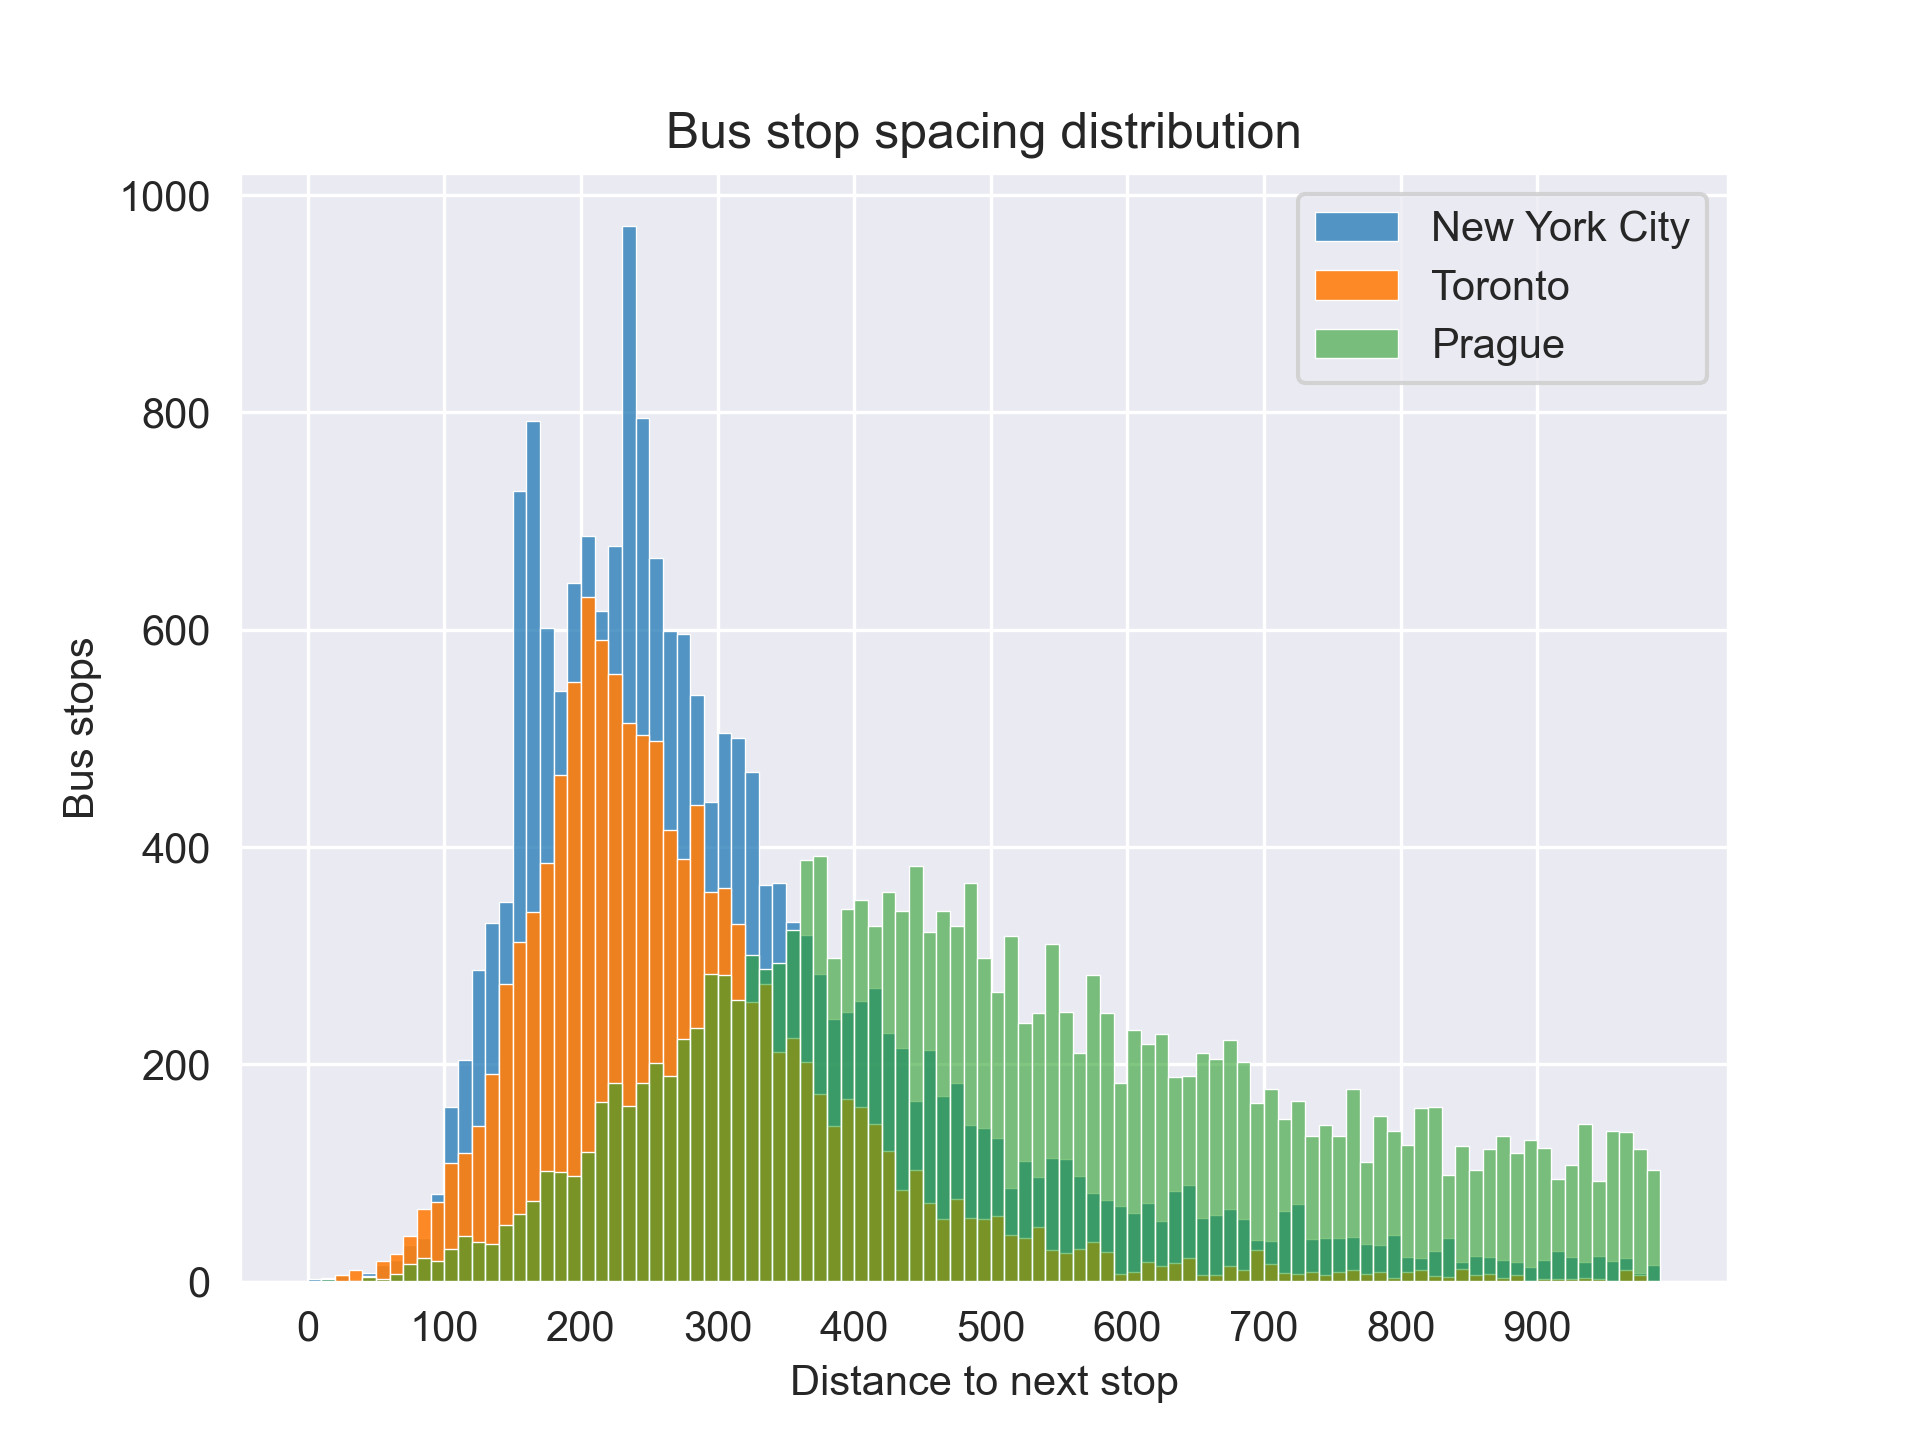
While transit experts generally recommend stop spacing around 400 meters for local bus lines, New York City averages much closer – the most common spacing distance is around 240 meters. However, New York is far from alone. Other North American cities such as Toronto and Boston have similar distributions. In contrast, European cities (Prague pictured above) tend to have infrequent stopping patterns for buses, especially in the suburbs.
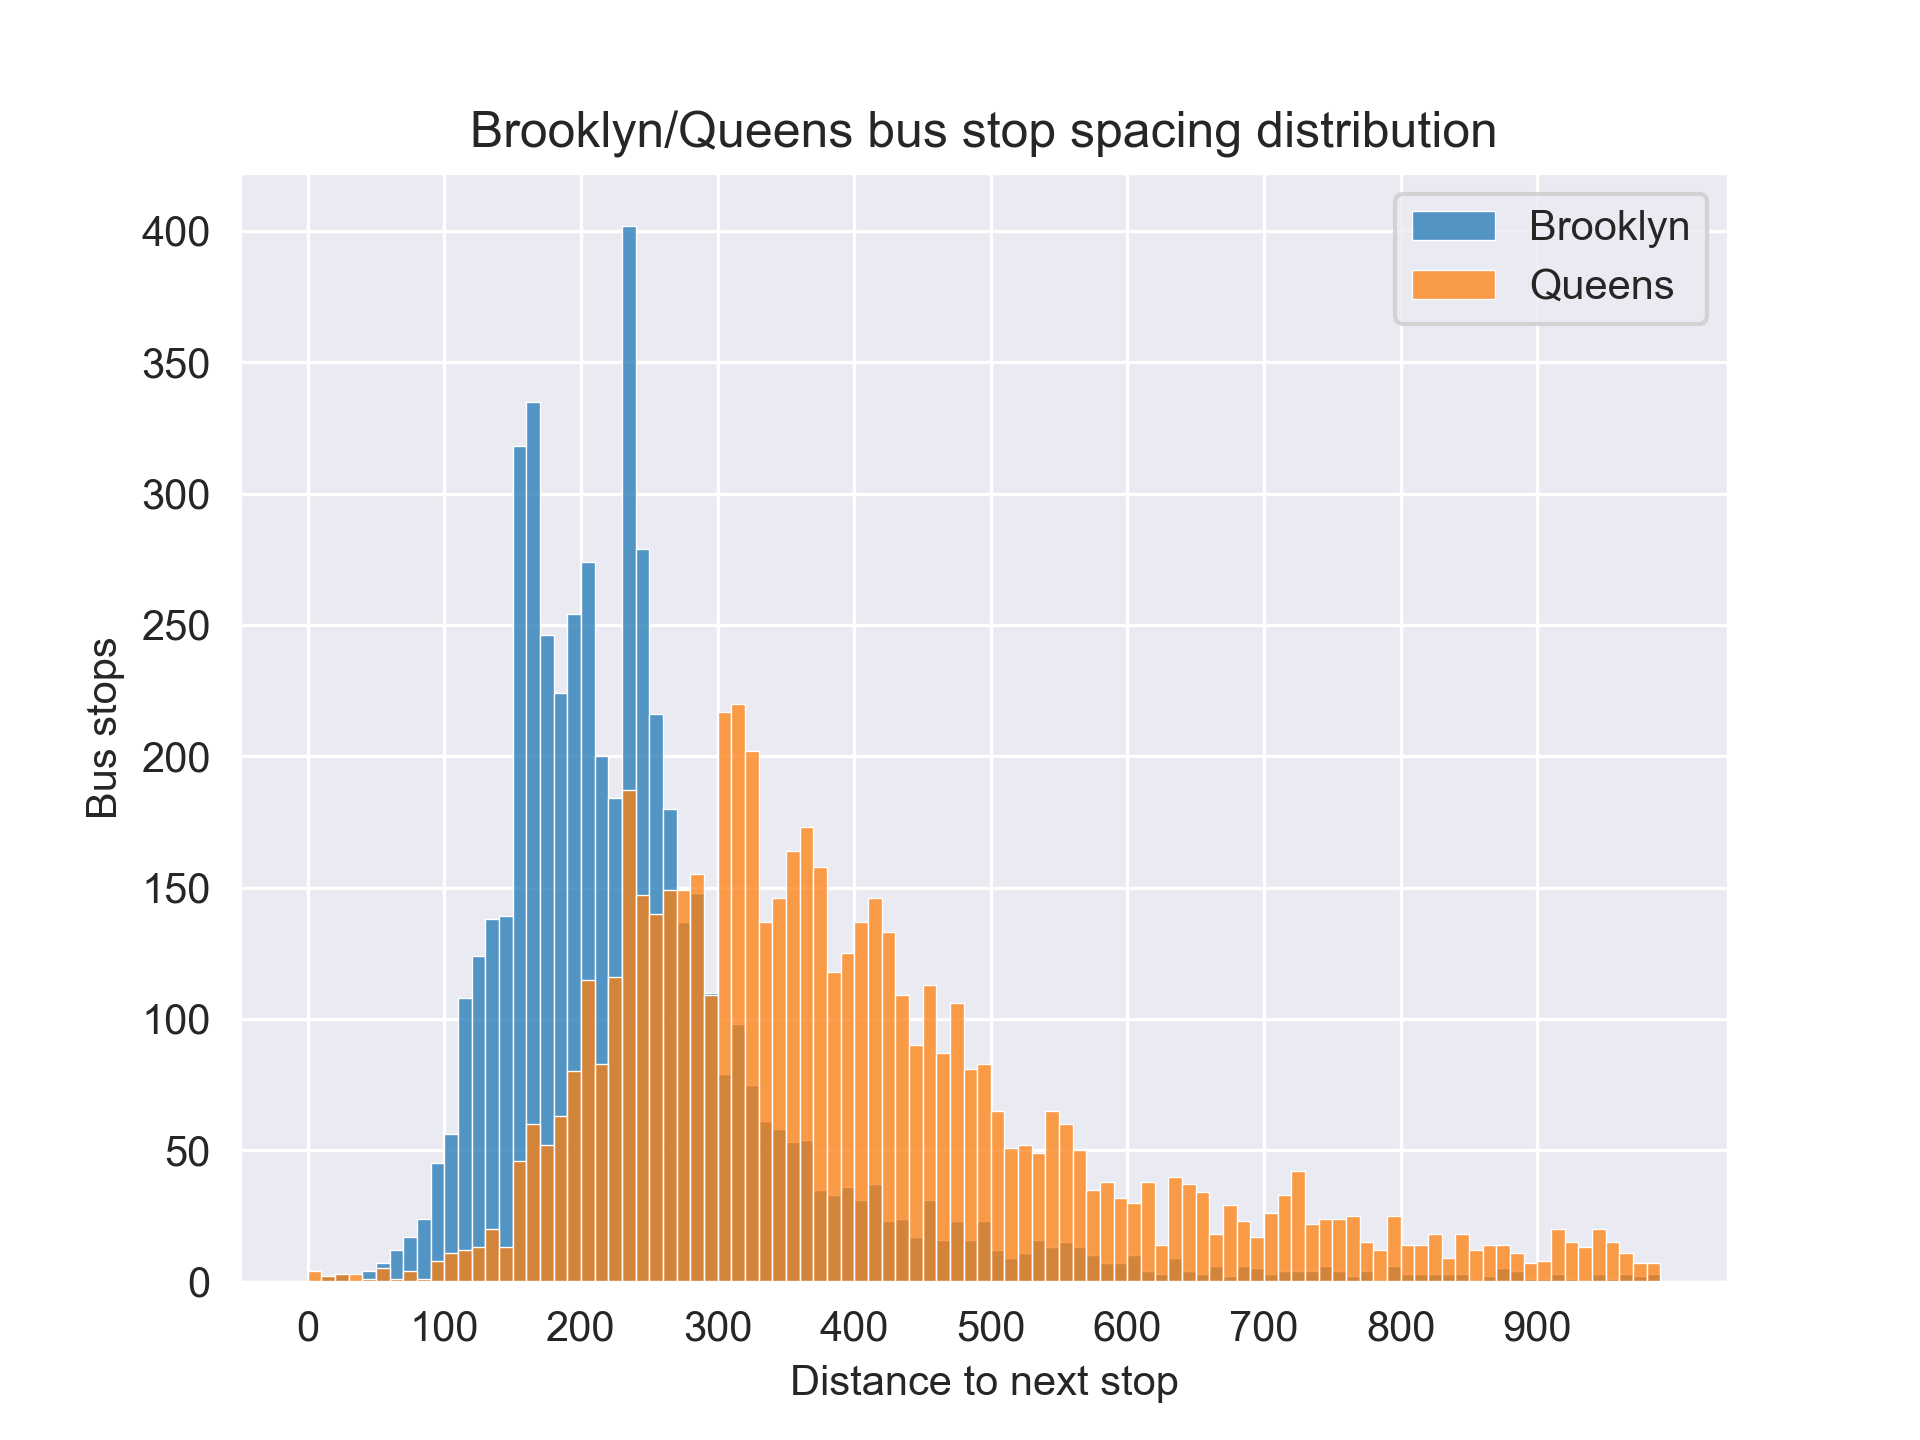
Not all parts of New York have similar stop statistics. The biggest contrast is between Brooklyn and Queens, both sprawling outer boroughs with a mix of high density and sububrban neighborhoods. However, Brooklyn has some of the tightest stop spacing in the city, while Queens buses run more efficiently* with 300-330 meter stop spacing the most common.
This is due to the Queens Bus Network Redesign, and using old GTFS data I found on the internet, it is possible to compare the difference.
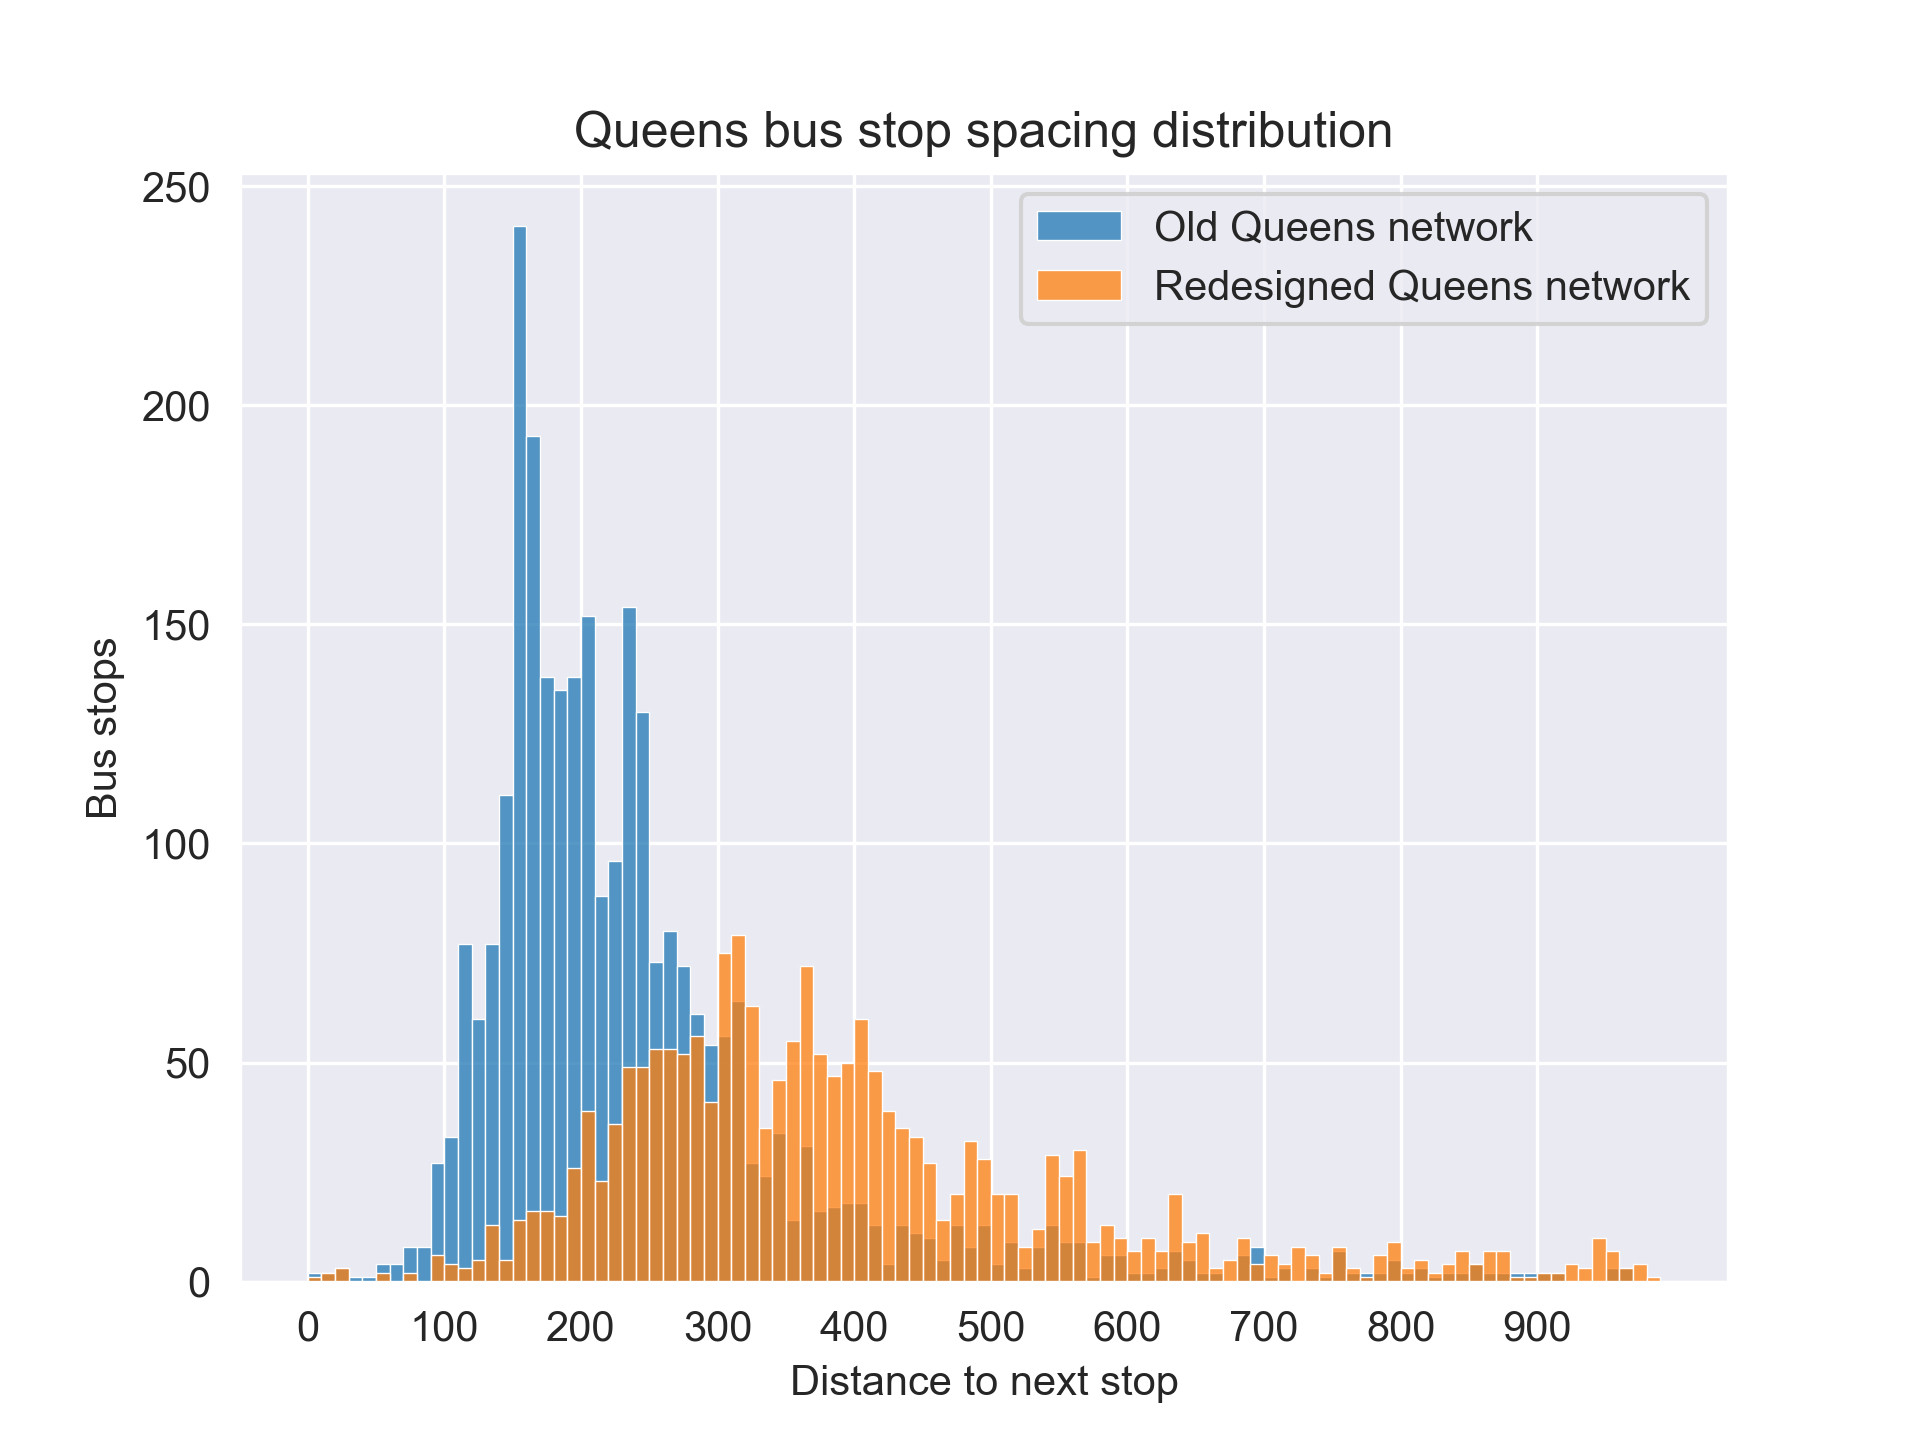
May the Brooklyn redesign come soon!
Los Angeles
Los Angeles shows a clear pattern due to the “Jefferson grid” used to survey and expropriate lands of the West. The mile-square grid was divided up into 1/2 and 1/4 mile subdivisions as neighborhoods developed, and the Los Angeles Metro bus data shows a strong mode at 1/4 mile (400 meters).
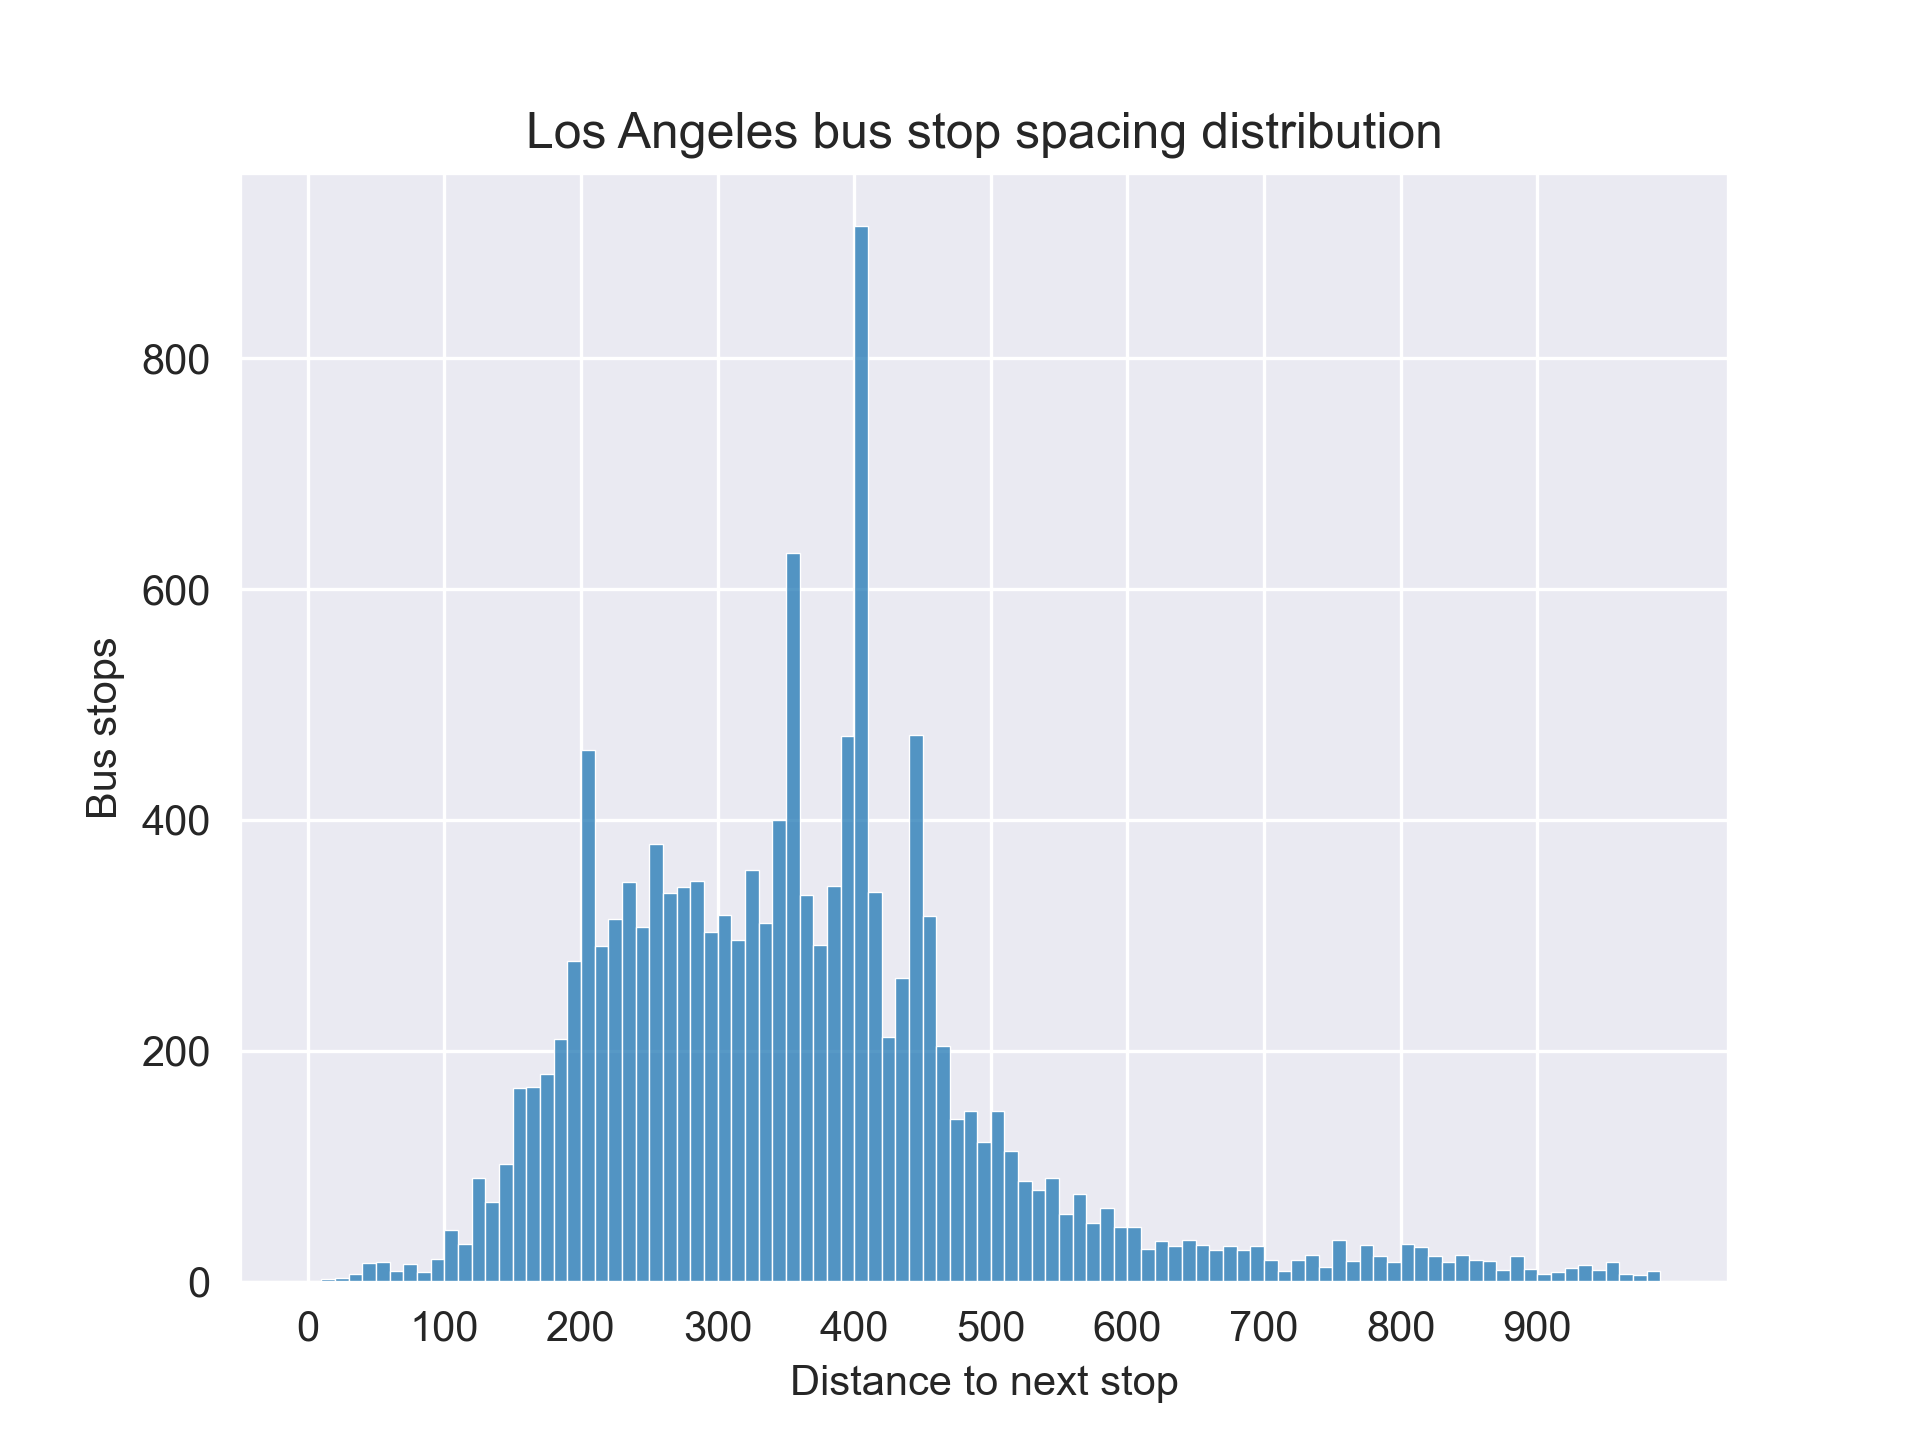
The “sidelobes” at about 365 meters and 435 meters are sitations where bus stops are both on the inner or outer side of a grid subdivision, shown below:
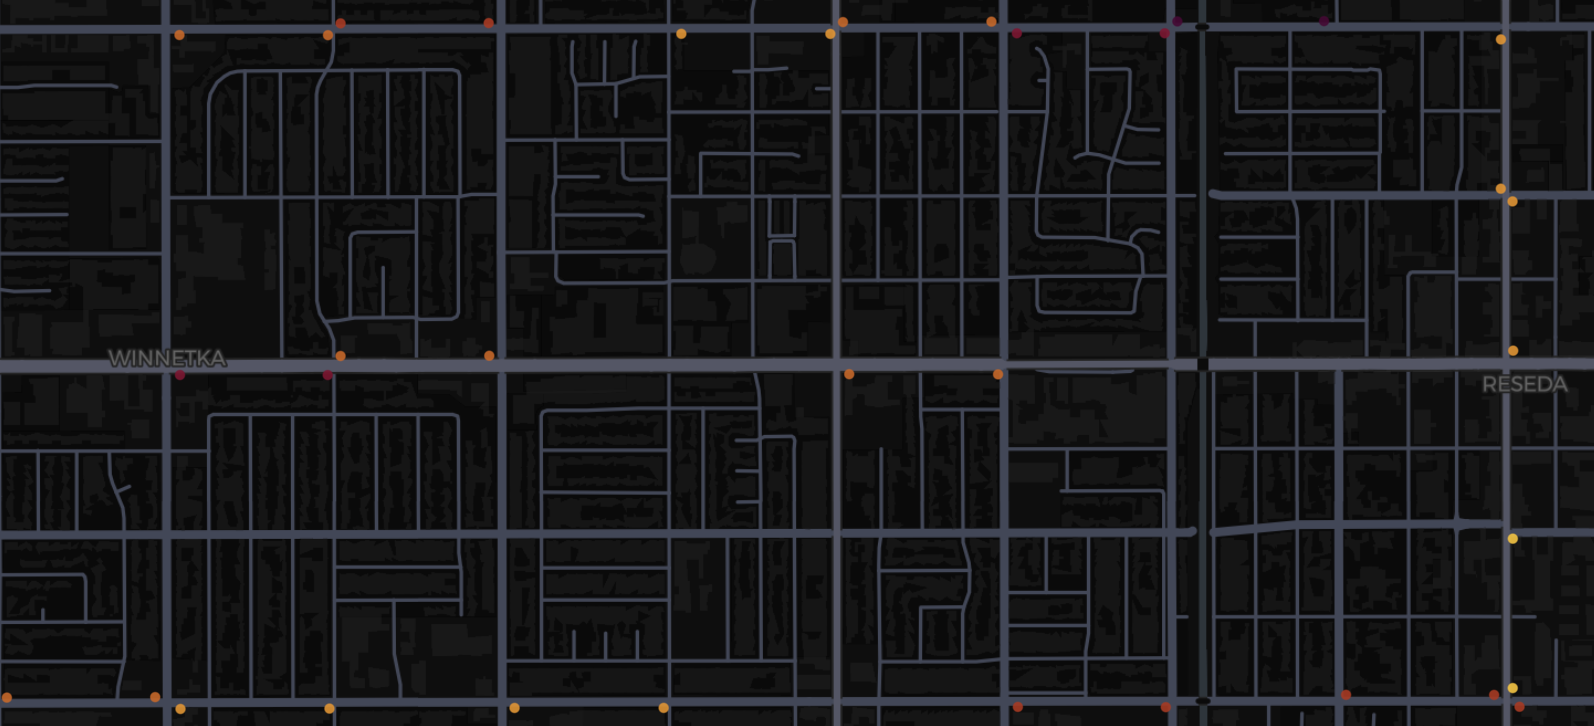
There is also a secondary mode visible at 1/8 of a miles (200 meters.)
The closest bus stops in New York
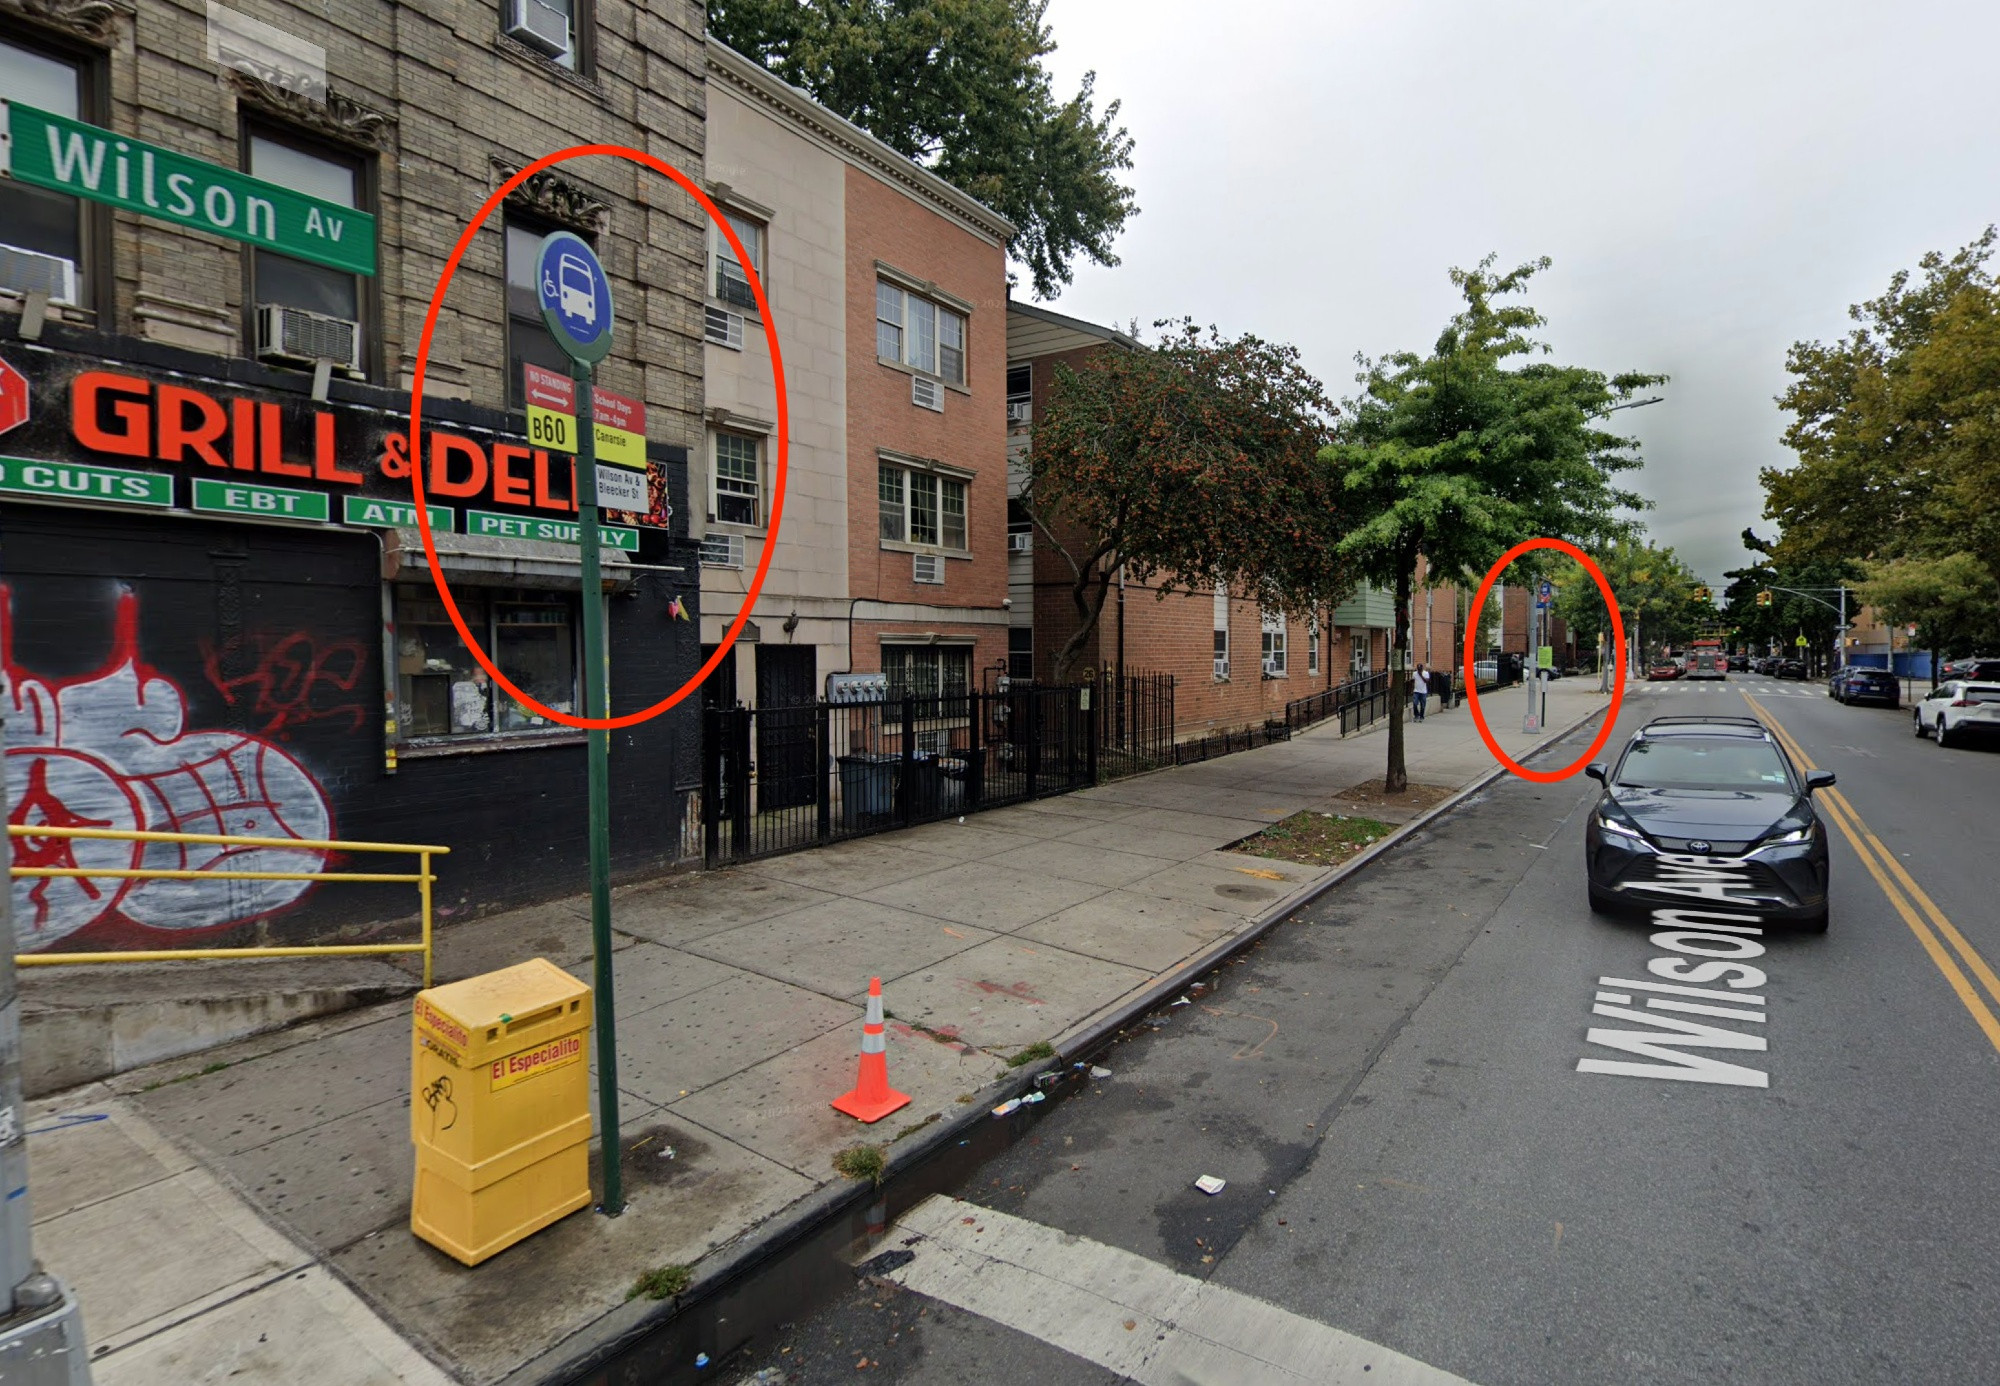
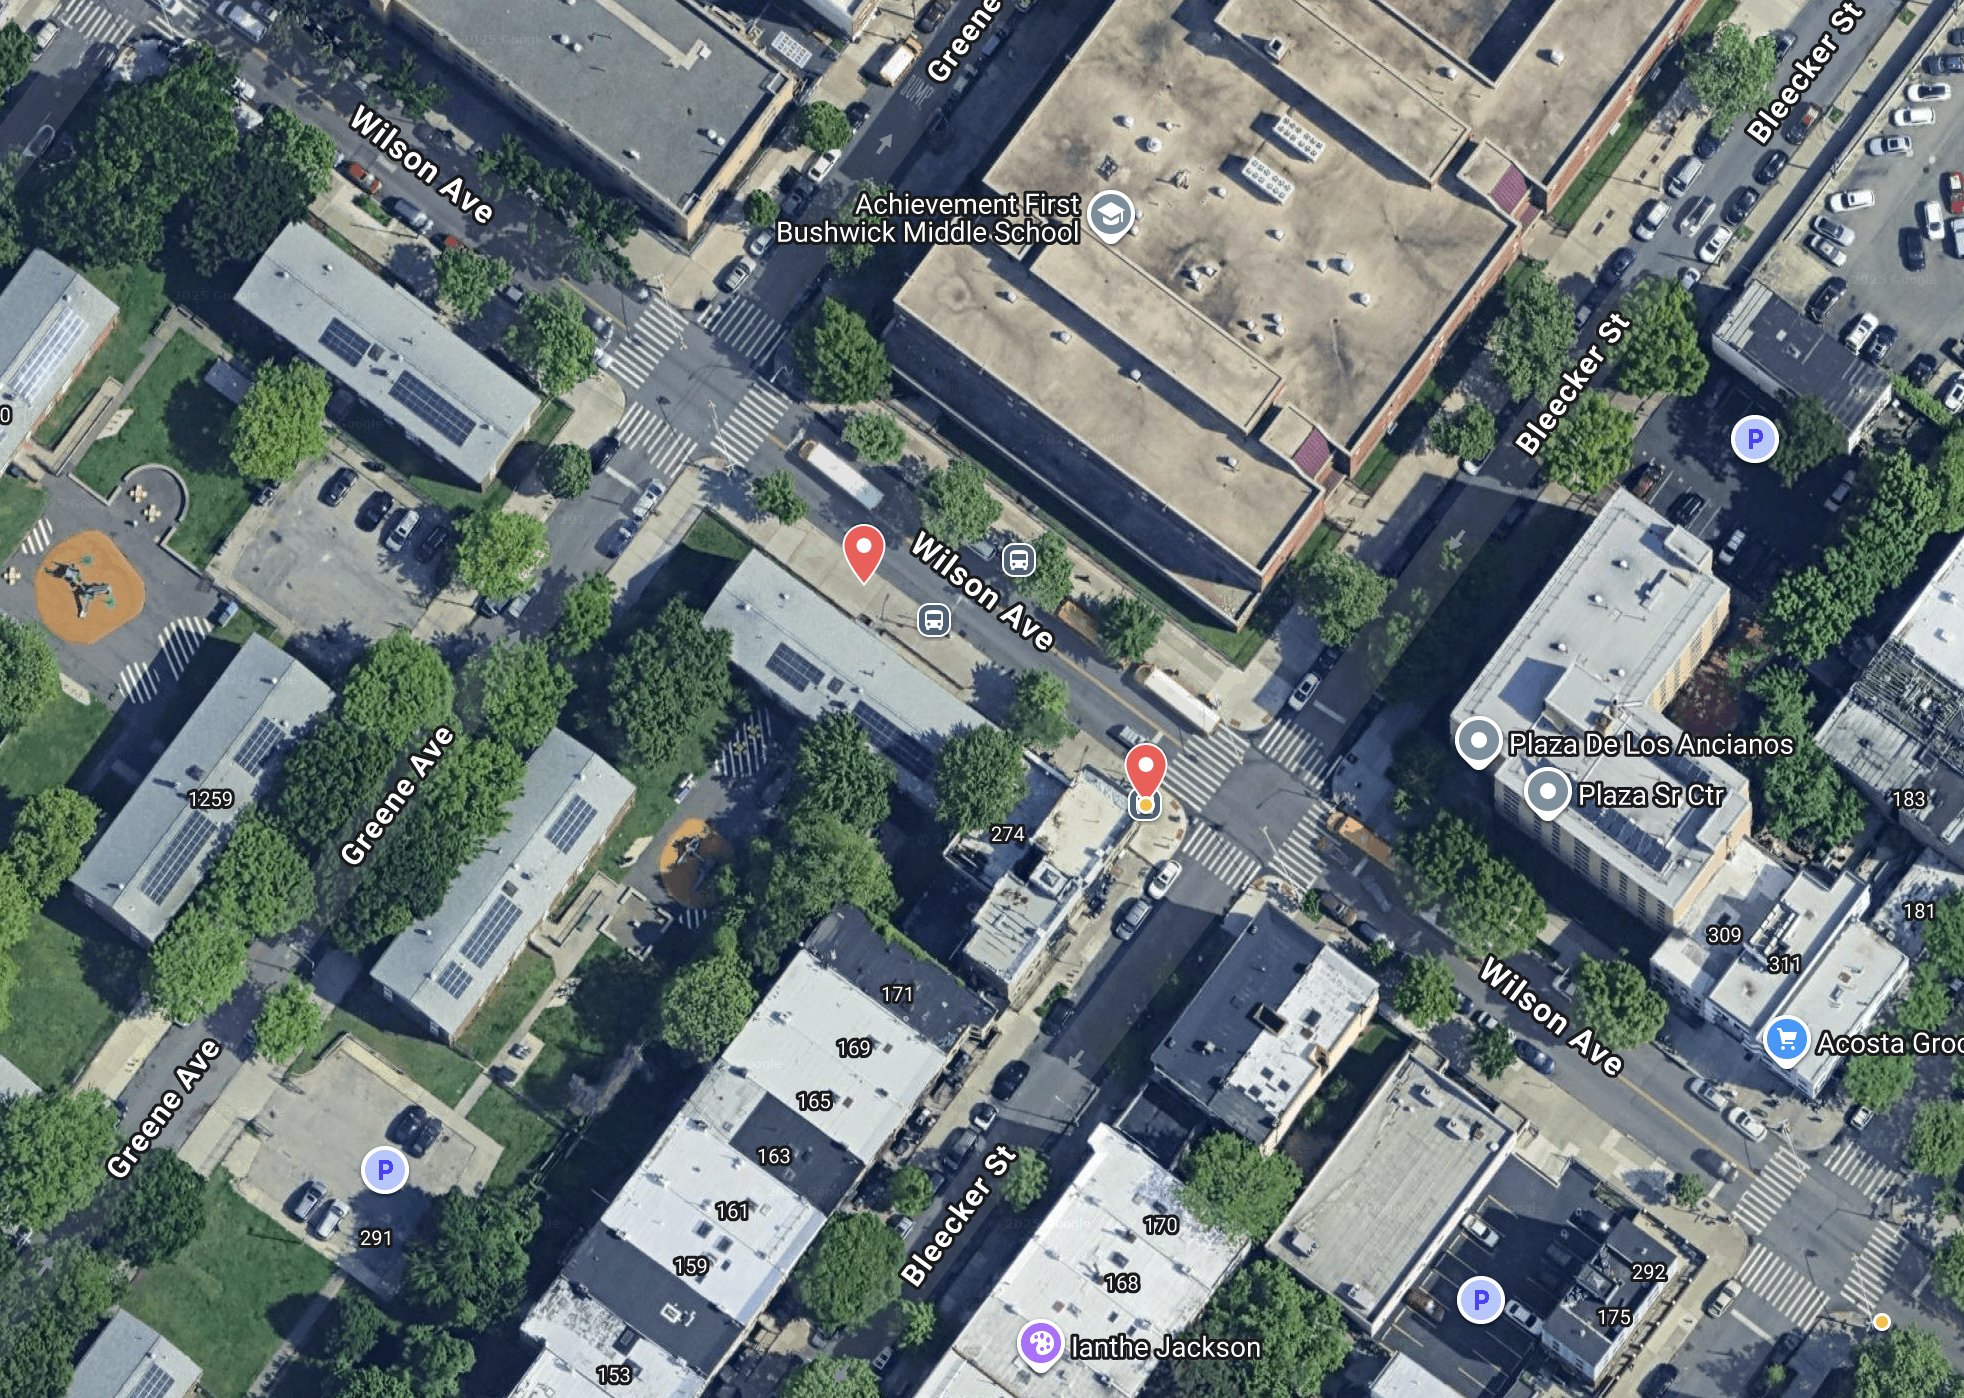
The two closest bus stops in New York are along the B60 route in Brooklyn. Between Greene Ave and Bleecker Street, a “short block” in the Bushwick grid, the B60 stops twice. Both bus stops are easily visible in this Google Street View image, they are only 40 meters from each other.
And in the Google Maps aerial view.
A map of New York City bus stops within 100 meters (330ft) and 150 meters (500ft) reveals clear borough-by-borough variation. Queens, with its recent redesign, has very few close bus stops, while Manhattan and Brooklyn have many. Uniquely dense Manhattan might justify close stops, but in much of Brooklyn it seems a consequence of poorly aged bus planning.
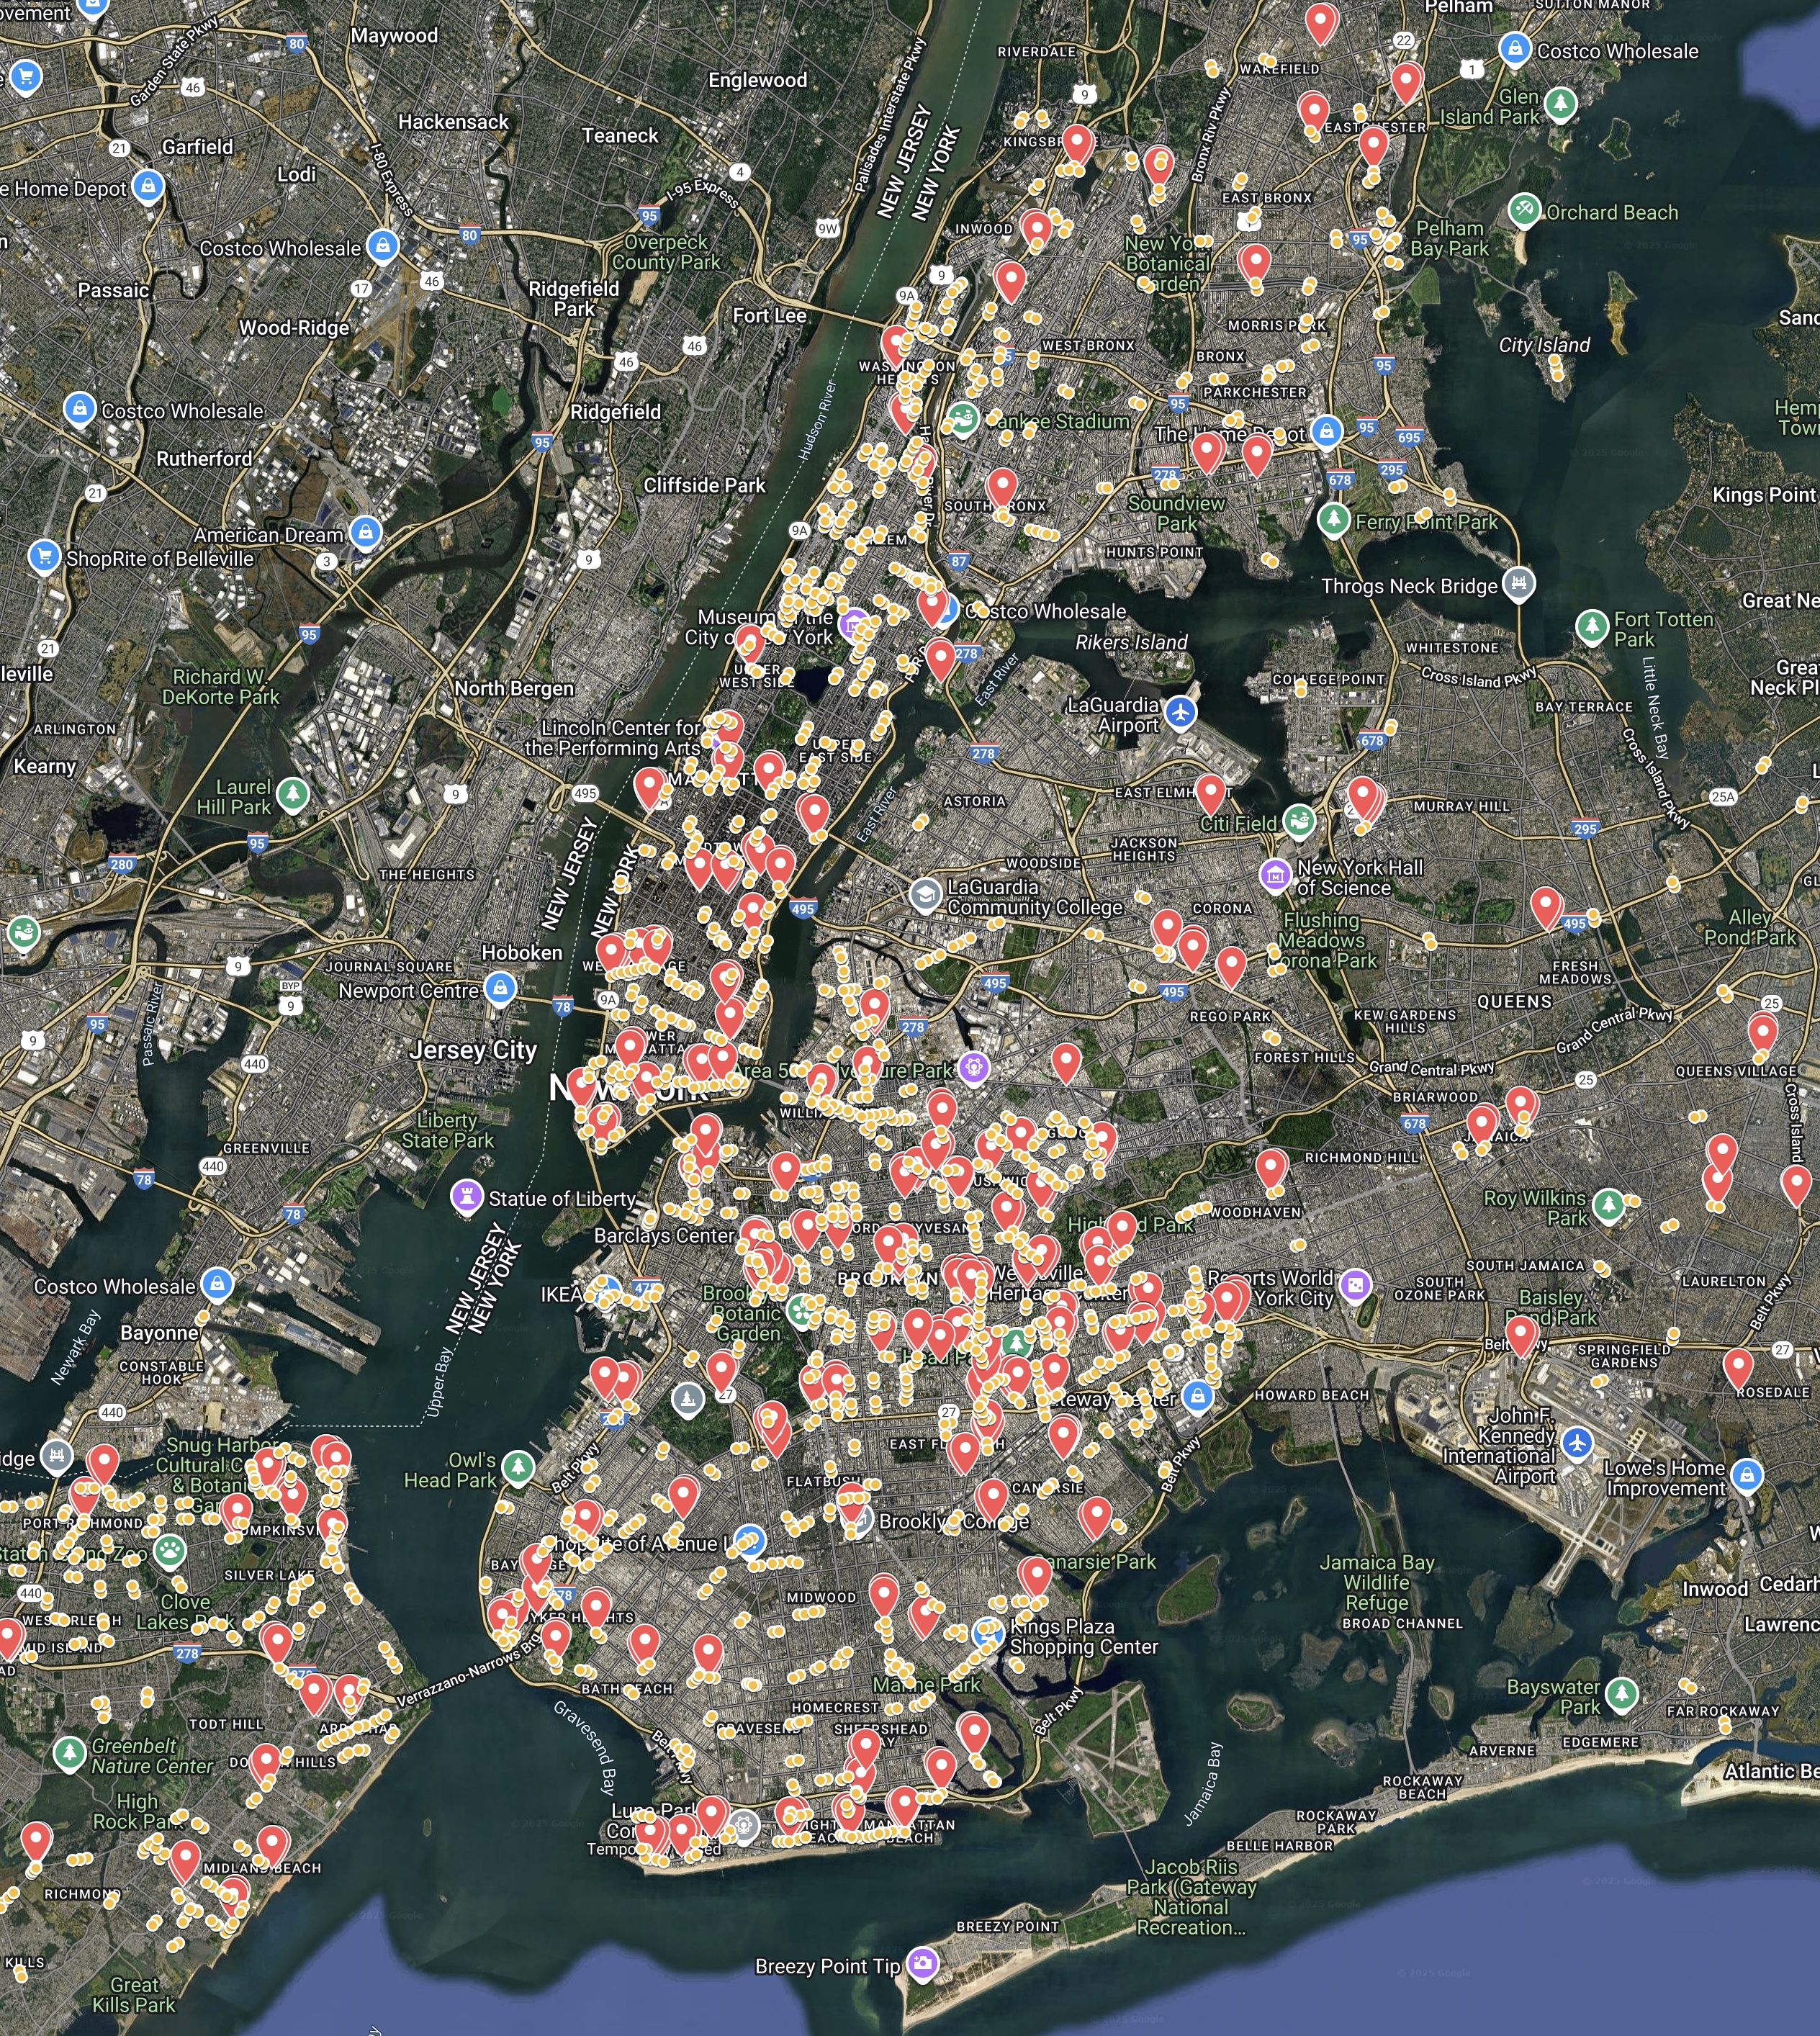
View the whole map.
Source code and other cities
No less than three GTFS tables must be joined to figure out which stops service which routes: “stops” (has the geographic location of stops), “trips” (has info for each trip run, including route and direction), and “stop_times” (has the times that each trip run stops at each stop and in which order).
The Jupyter notebook below loads GTFS data and calculates the distance between sequential stop on each route in the GTFS schedule. You can load any city’s GTFS data to make a custom plot. Note that GTFS data is often inaccurate, and might contain “fake” stops that serve some technical purpose.
See also
* Though not necessarily faster…